Conclusion
This case study only covers one aspect of the entire application.
This application works as a golden database for all users across Marine operations.
Before getting on with the application, as designers we performed a Heuristic Evaluation using Jakob’s law. This helped us understand the product as well as certain design language that was already set by the previous designer.
Design and development went hand-in-hand. Enhancements on this module was also taken up at a later stage.
This module was interesting to take on as this wasn’t present in the legacy application that we were redesigning.
Climate
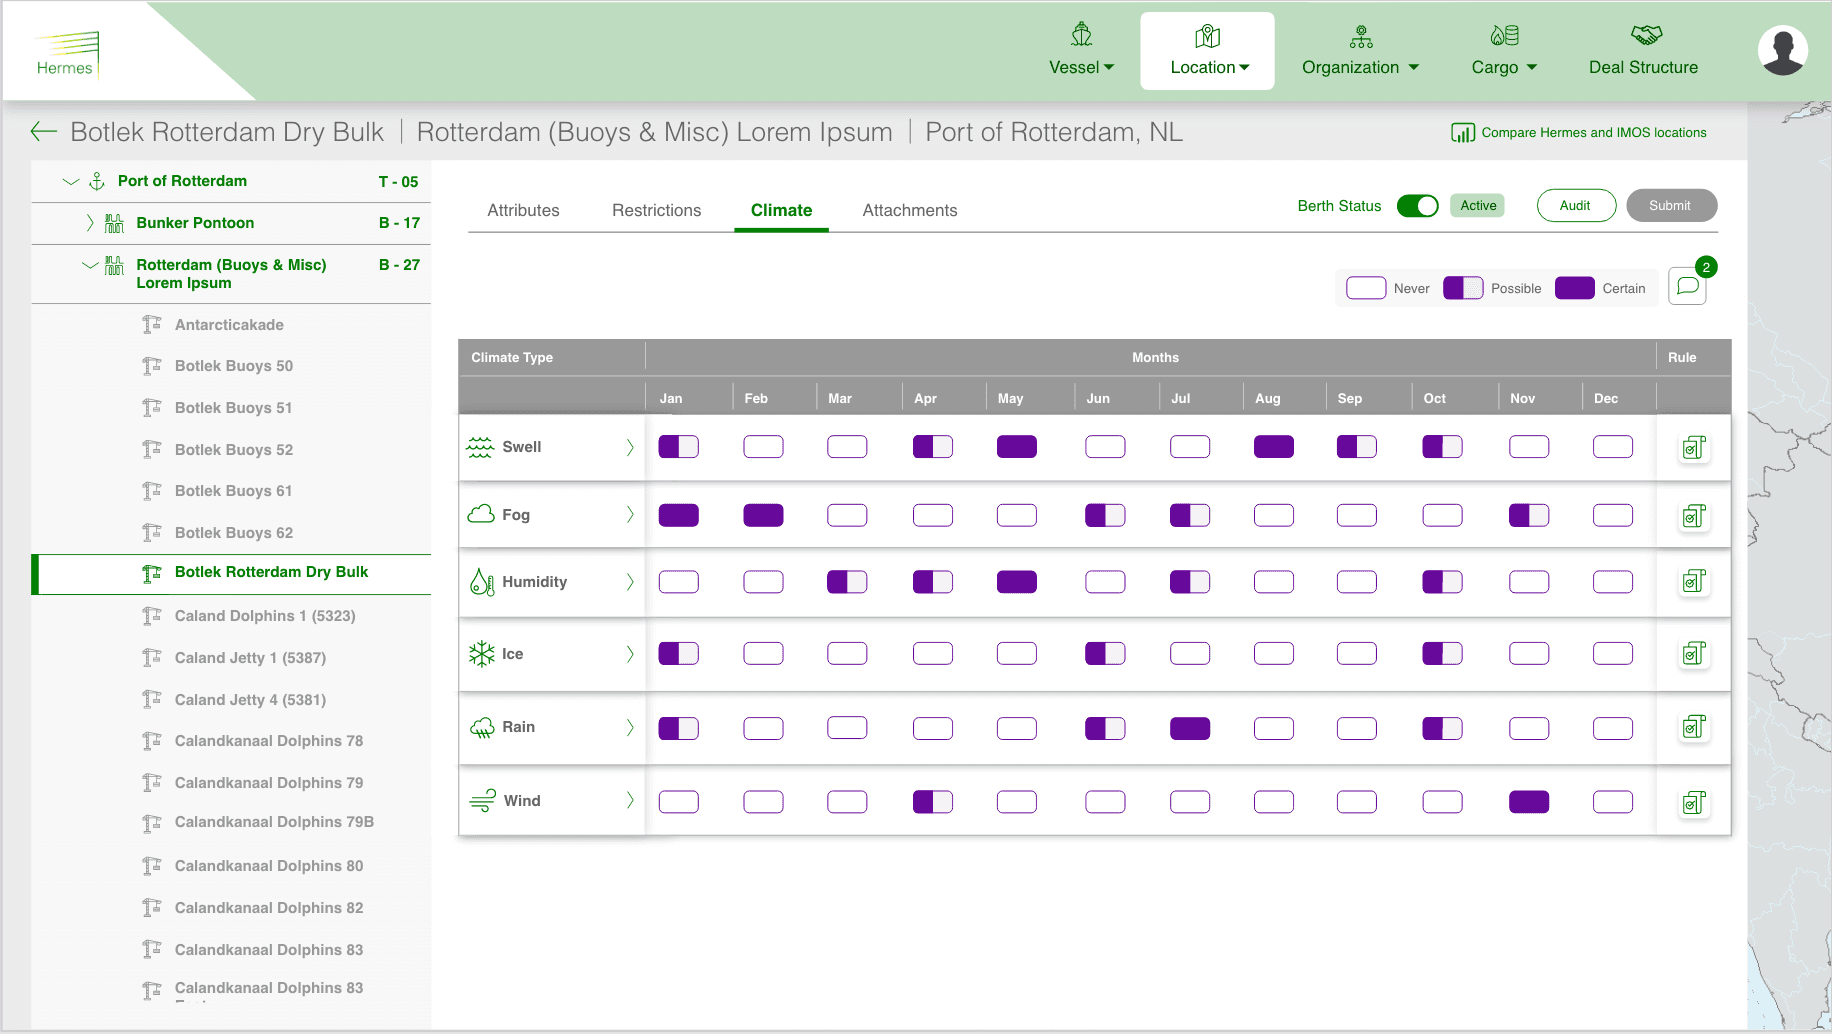
In order to plan voyages, assess vessels, users need to know the climate in and around that location throughout the year. Marine operations involve a lot of planning majorly for the future, for example, having an assessment scheduled a year prior to the actual date.
Climate feature aids them in planning their schedule much in advance.
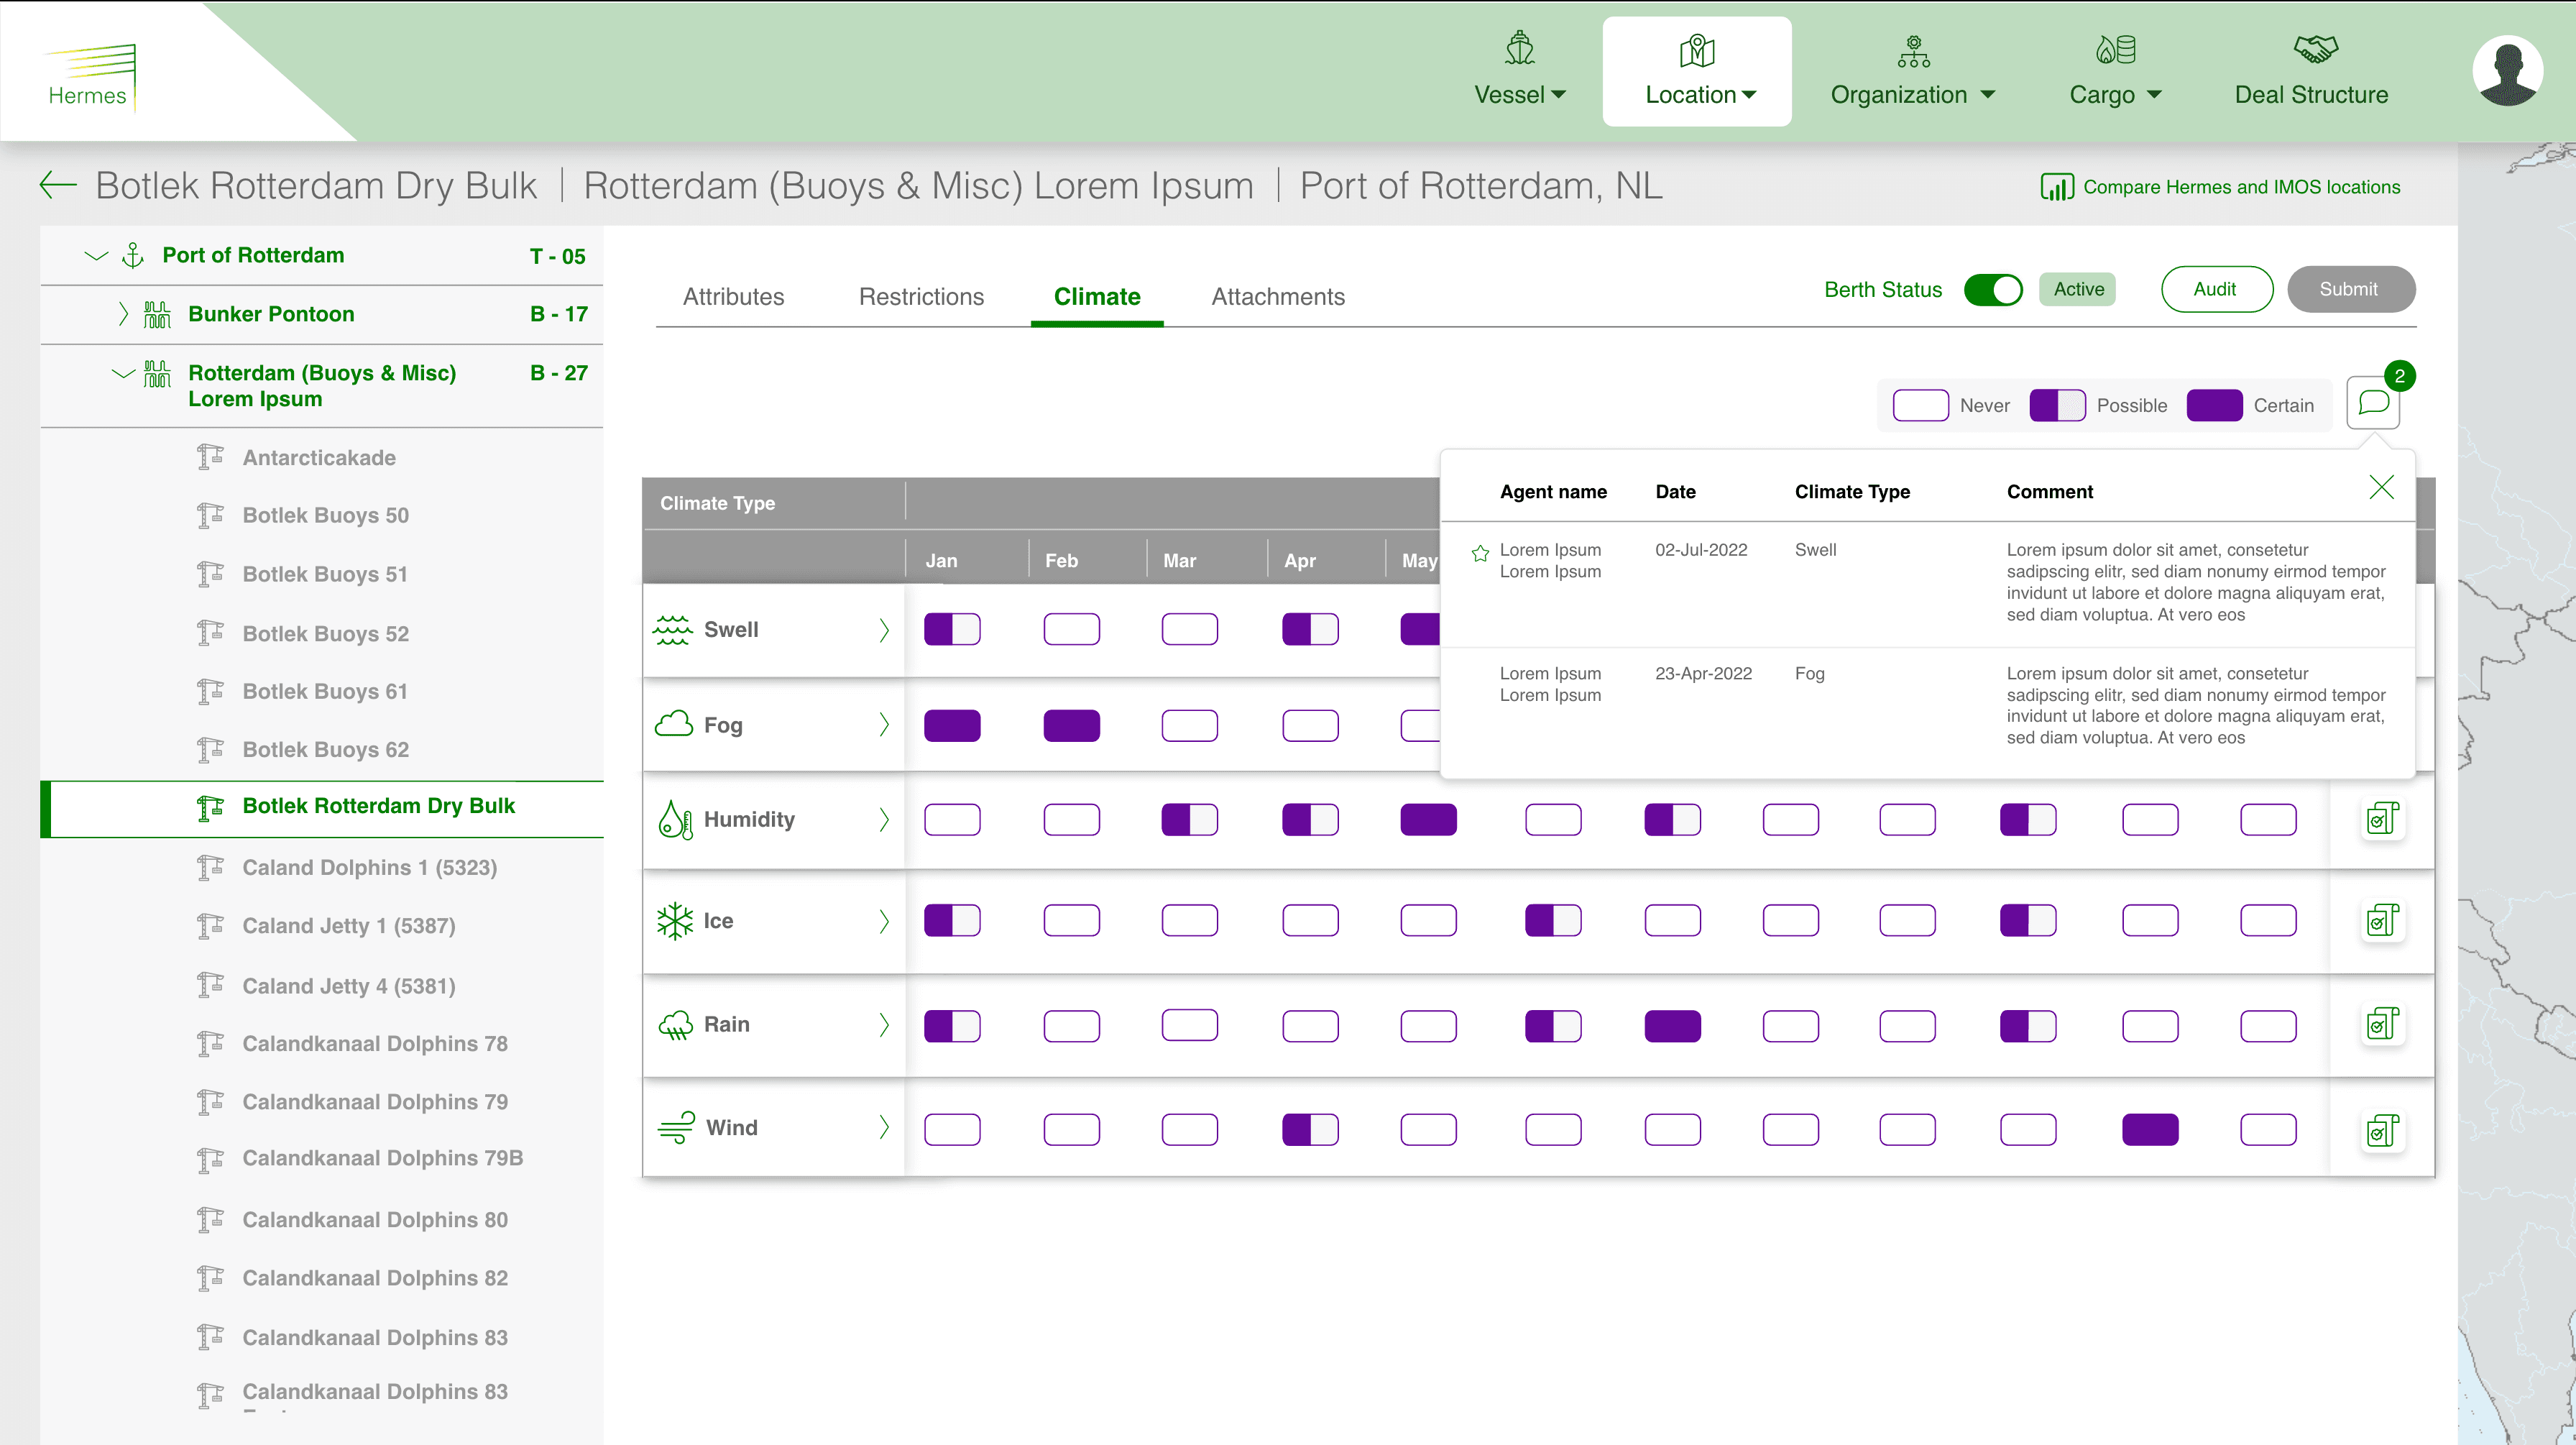
The screen displays the weather of that particular berth around the year, with indicators of probability.
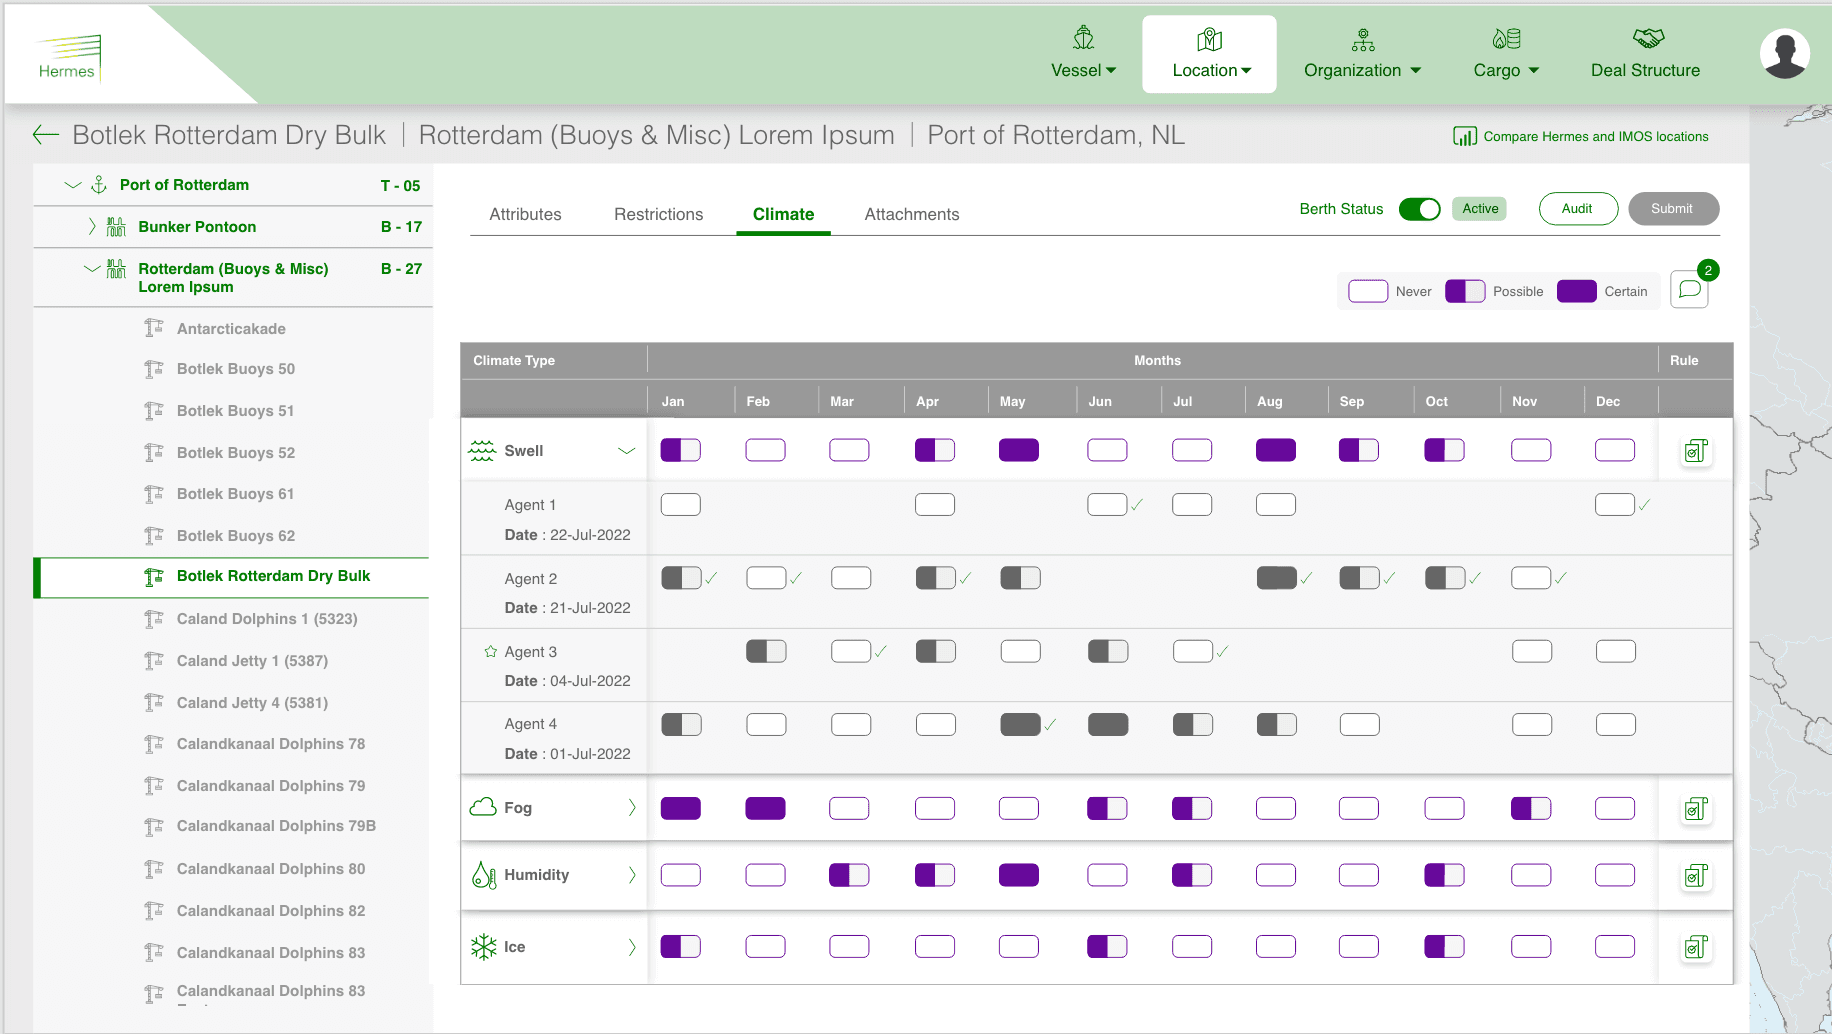
Data sources or Agents that are the sources of this information are multiple, hence the latest is displayed upfront.
Comments made by these agents are also displayed for additional information.
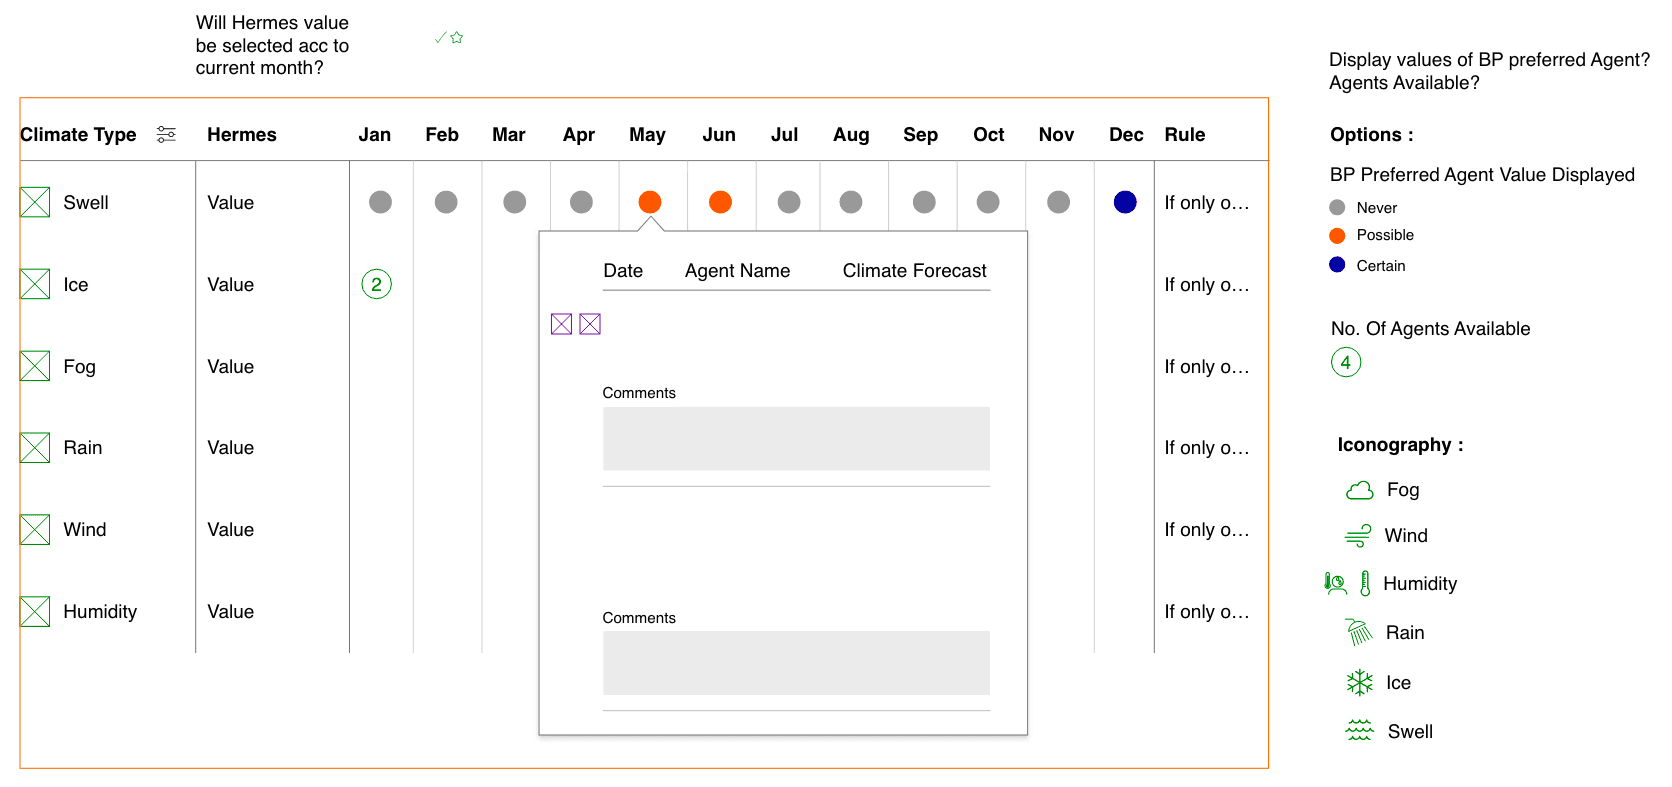
Ideation & wireframing the climate screen
Indicators across the span of a year at a particular location
Expanded section reveals the multiple agents with their values
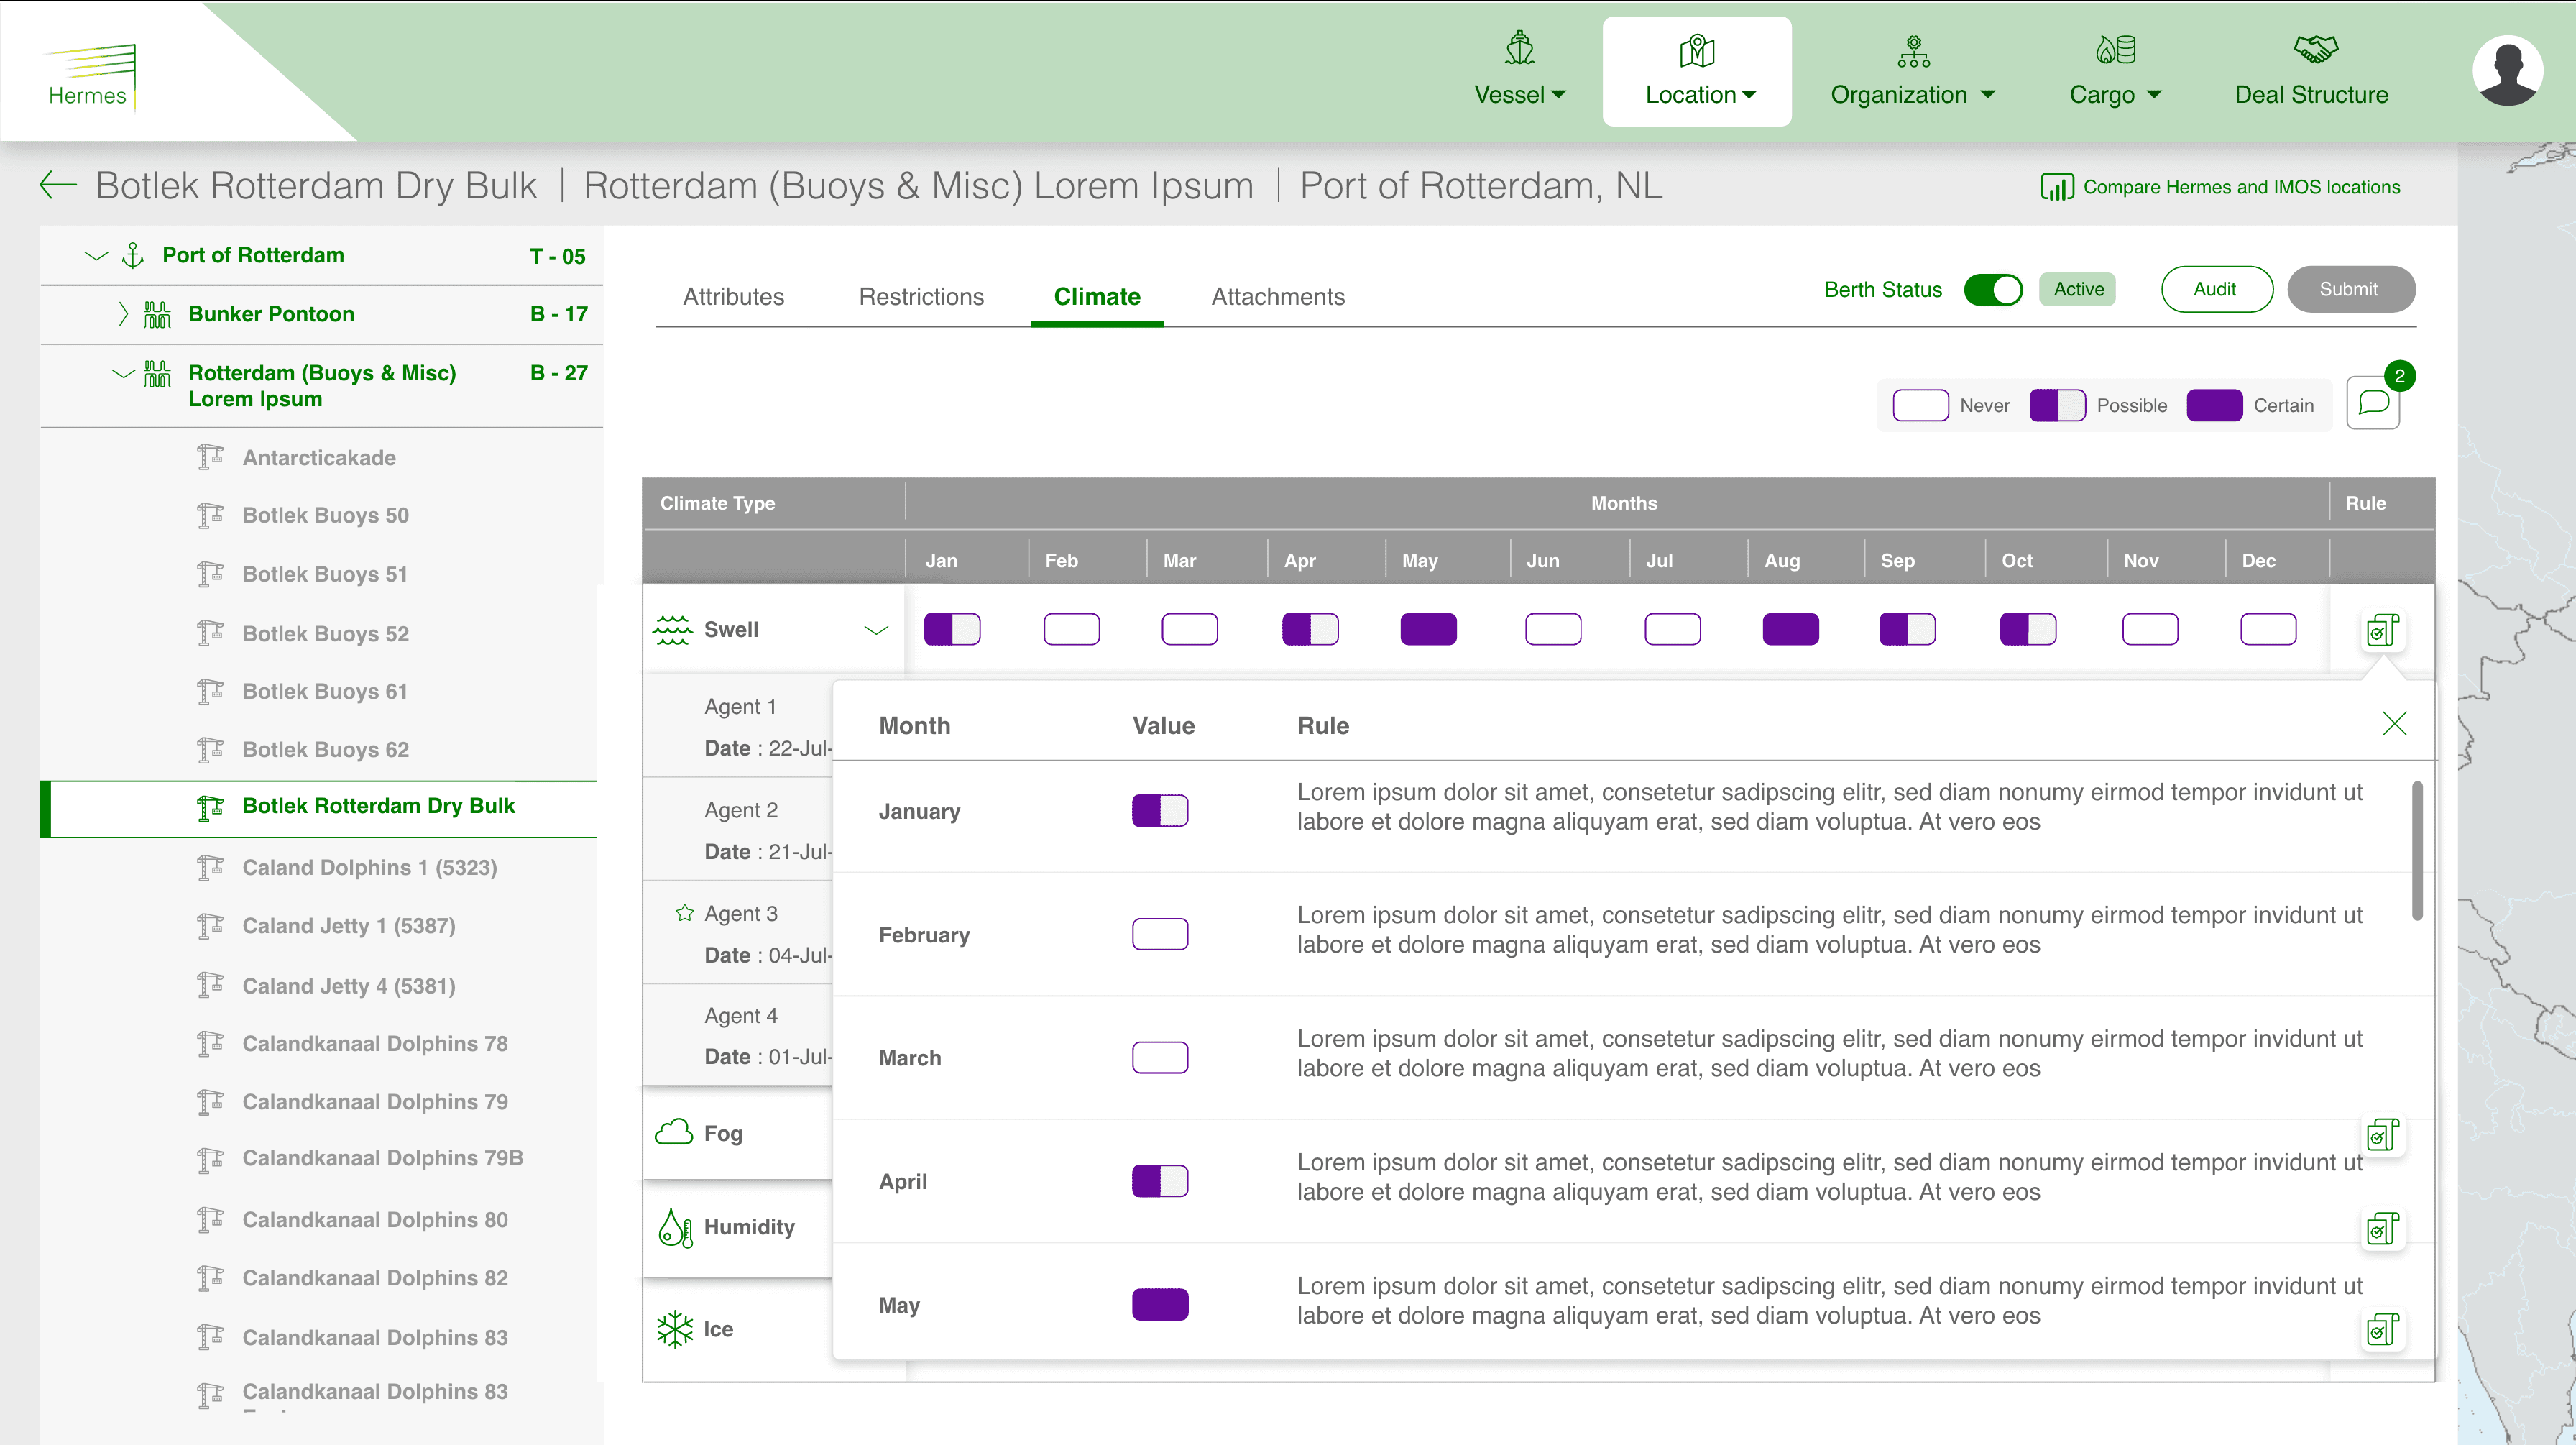
Rule is run to determine the value for every month for every climate type
Comments made by agents can be viewed
Map Plotting & Measure
Users want the search result to be plotted on the map, to have an understanding of where the Port/Terminal/Berth is located at a global level.
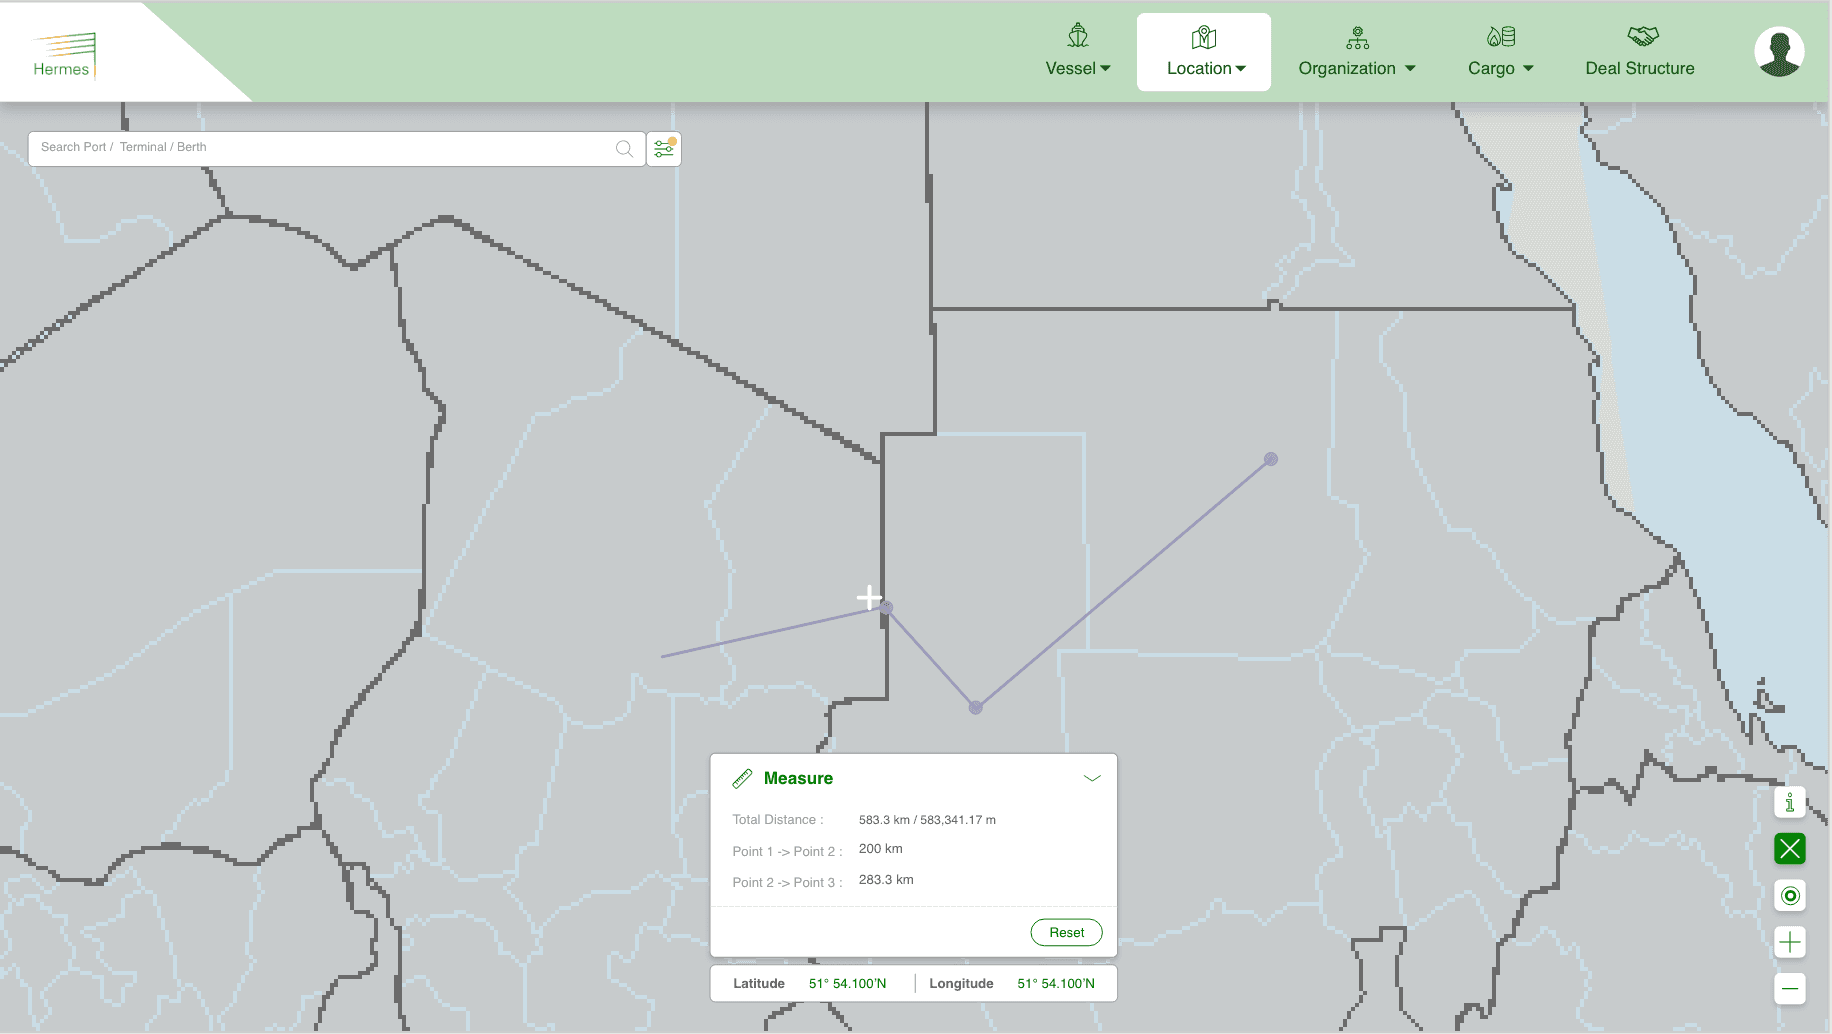
Users need a tool with which they can find out the area/perimeter of location or find out the distance between two or more locations
Using this plotted area users can use the ‘Measure’ feature to measure the area, perimeter of a polygon or distance between two points on the map. This tool is independent of the search result, hence users can use the tool without having to search for a location or they can also draw points over an already plotted area on the map.
To dig further into a particular location, users can hover over the plotted area and visit the details screen of each location.
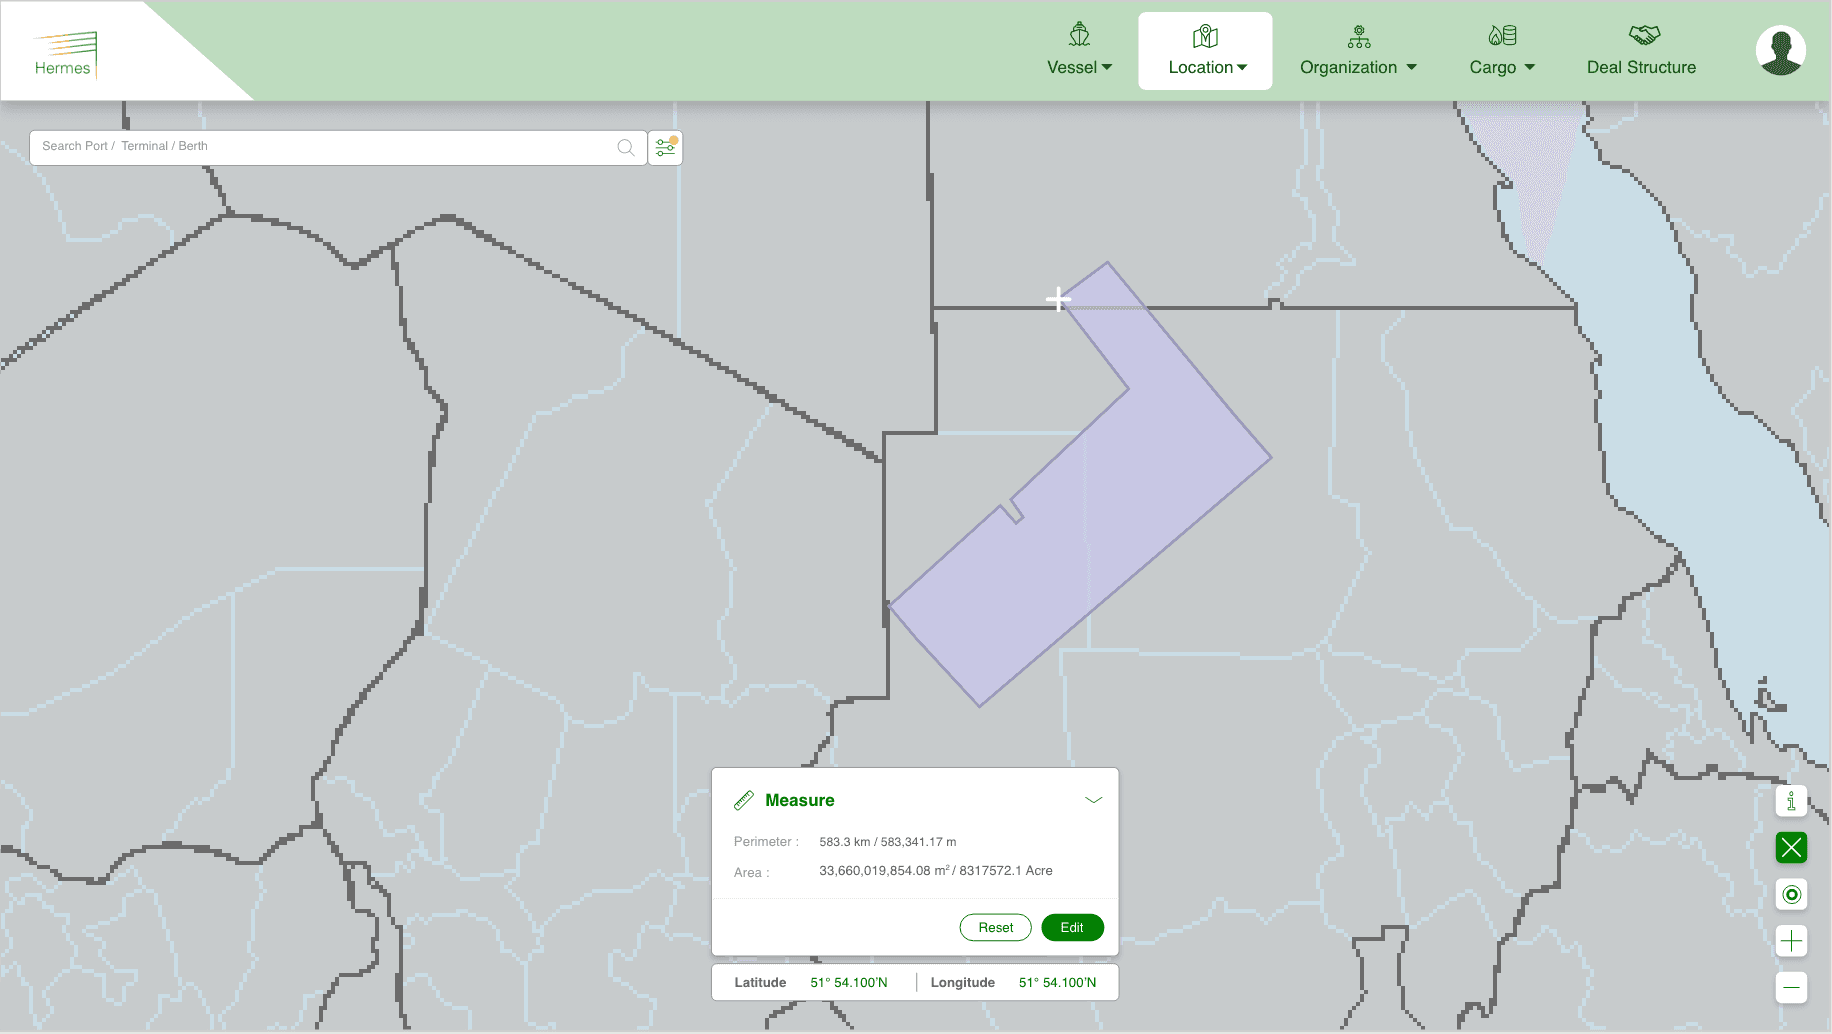

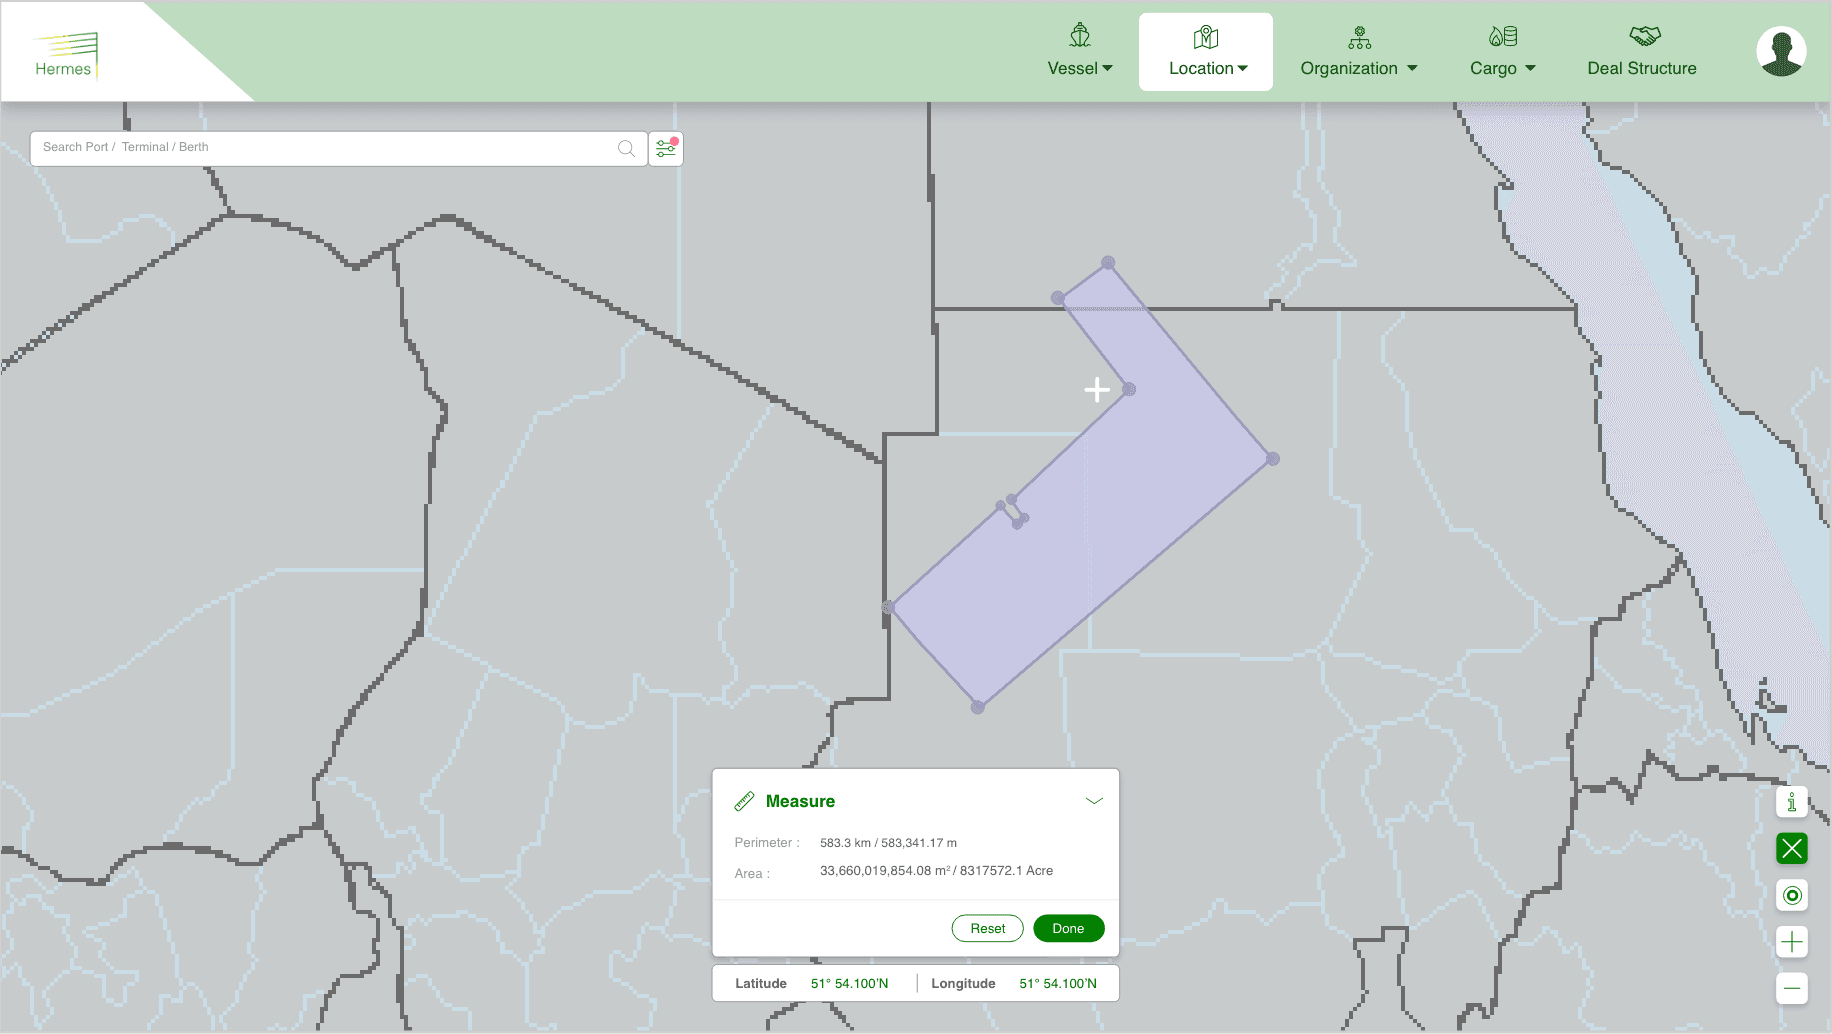
Plot points to form a polygon on the map
Collapsible feature to not hinder view of the map
Ability to edit the points on the polygon drawn
Not just polygon, points can also be measured
Screen Designing
Tackling complex problems with simple solutions
Search
An elaborate search bar and filter was designed to cater to the user needs.
User should be able to -
Search for any port / terminal / berth
Depending on the search result, option to view the hierarchy should be included (If the search result includes a port, then all terminals and berths under it should be visible)
Information to be displayed alongside the Port/Terminal/Berth name should be specific as there are many cases of duplicates present in the database
There should be visible differentiation of a Port/Terminal/Berth
Reusability - The component was re-used in a sister application used by a similar set of users within the organisation
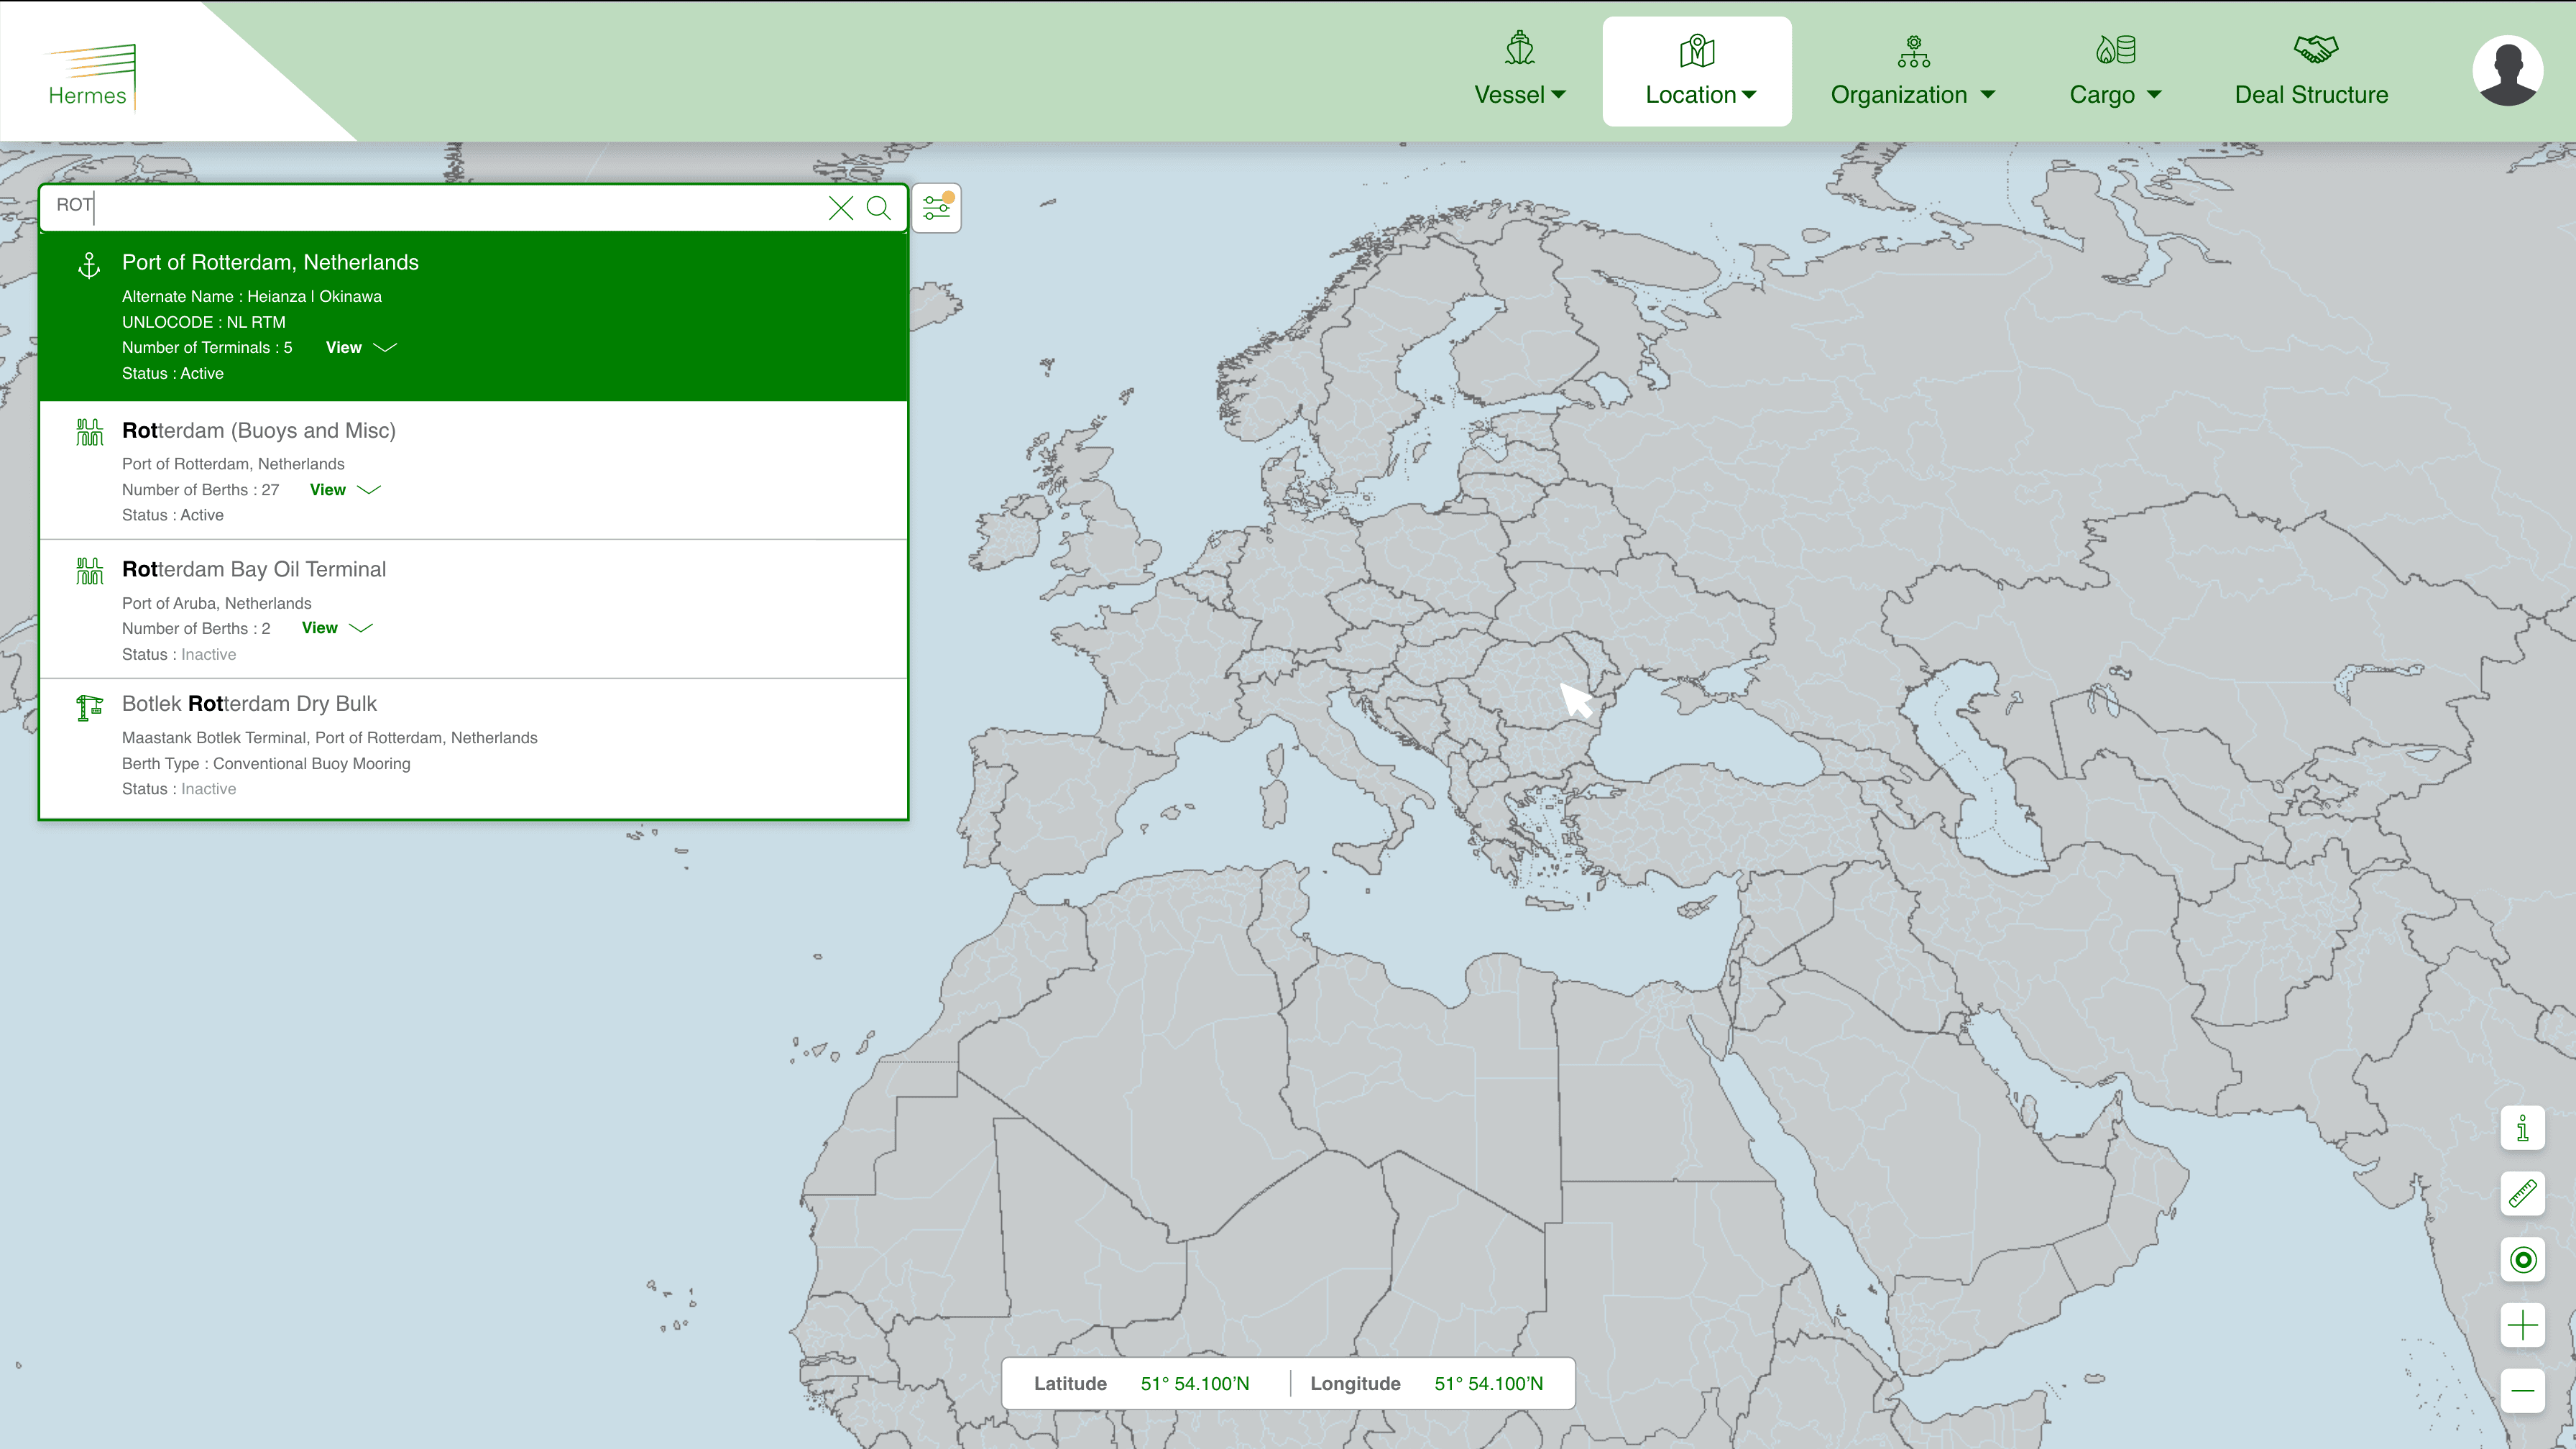
Dropdown results
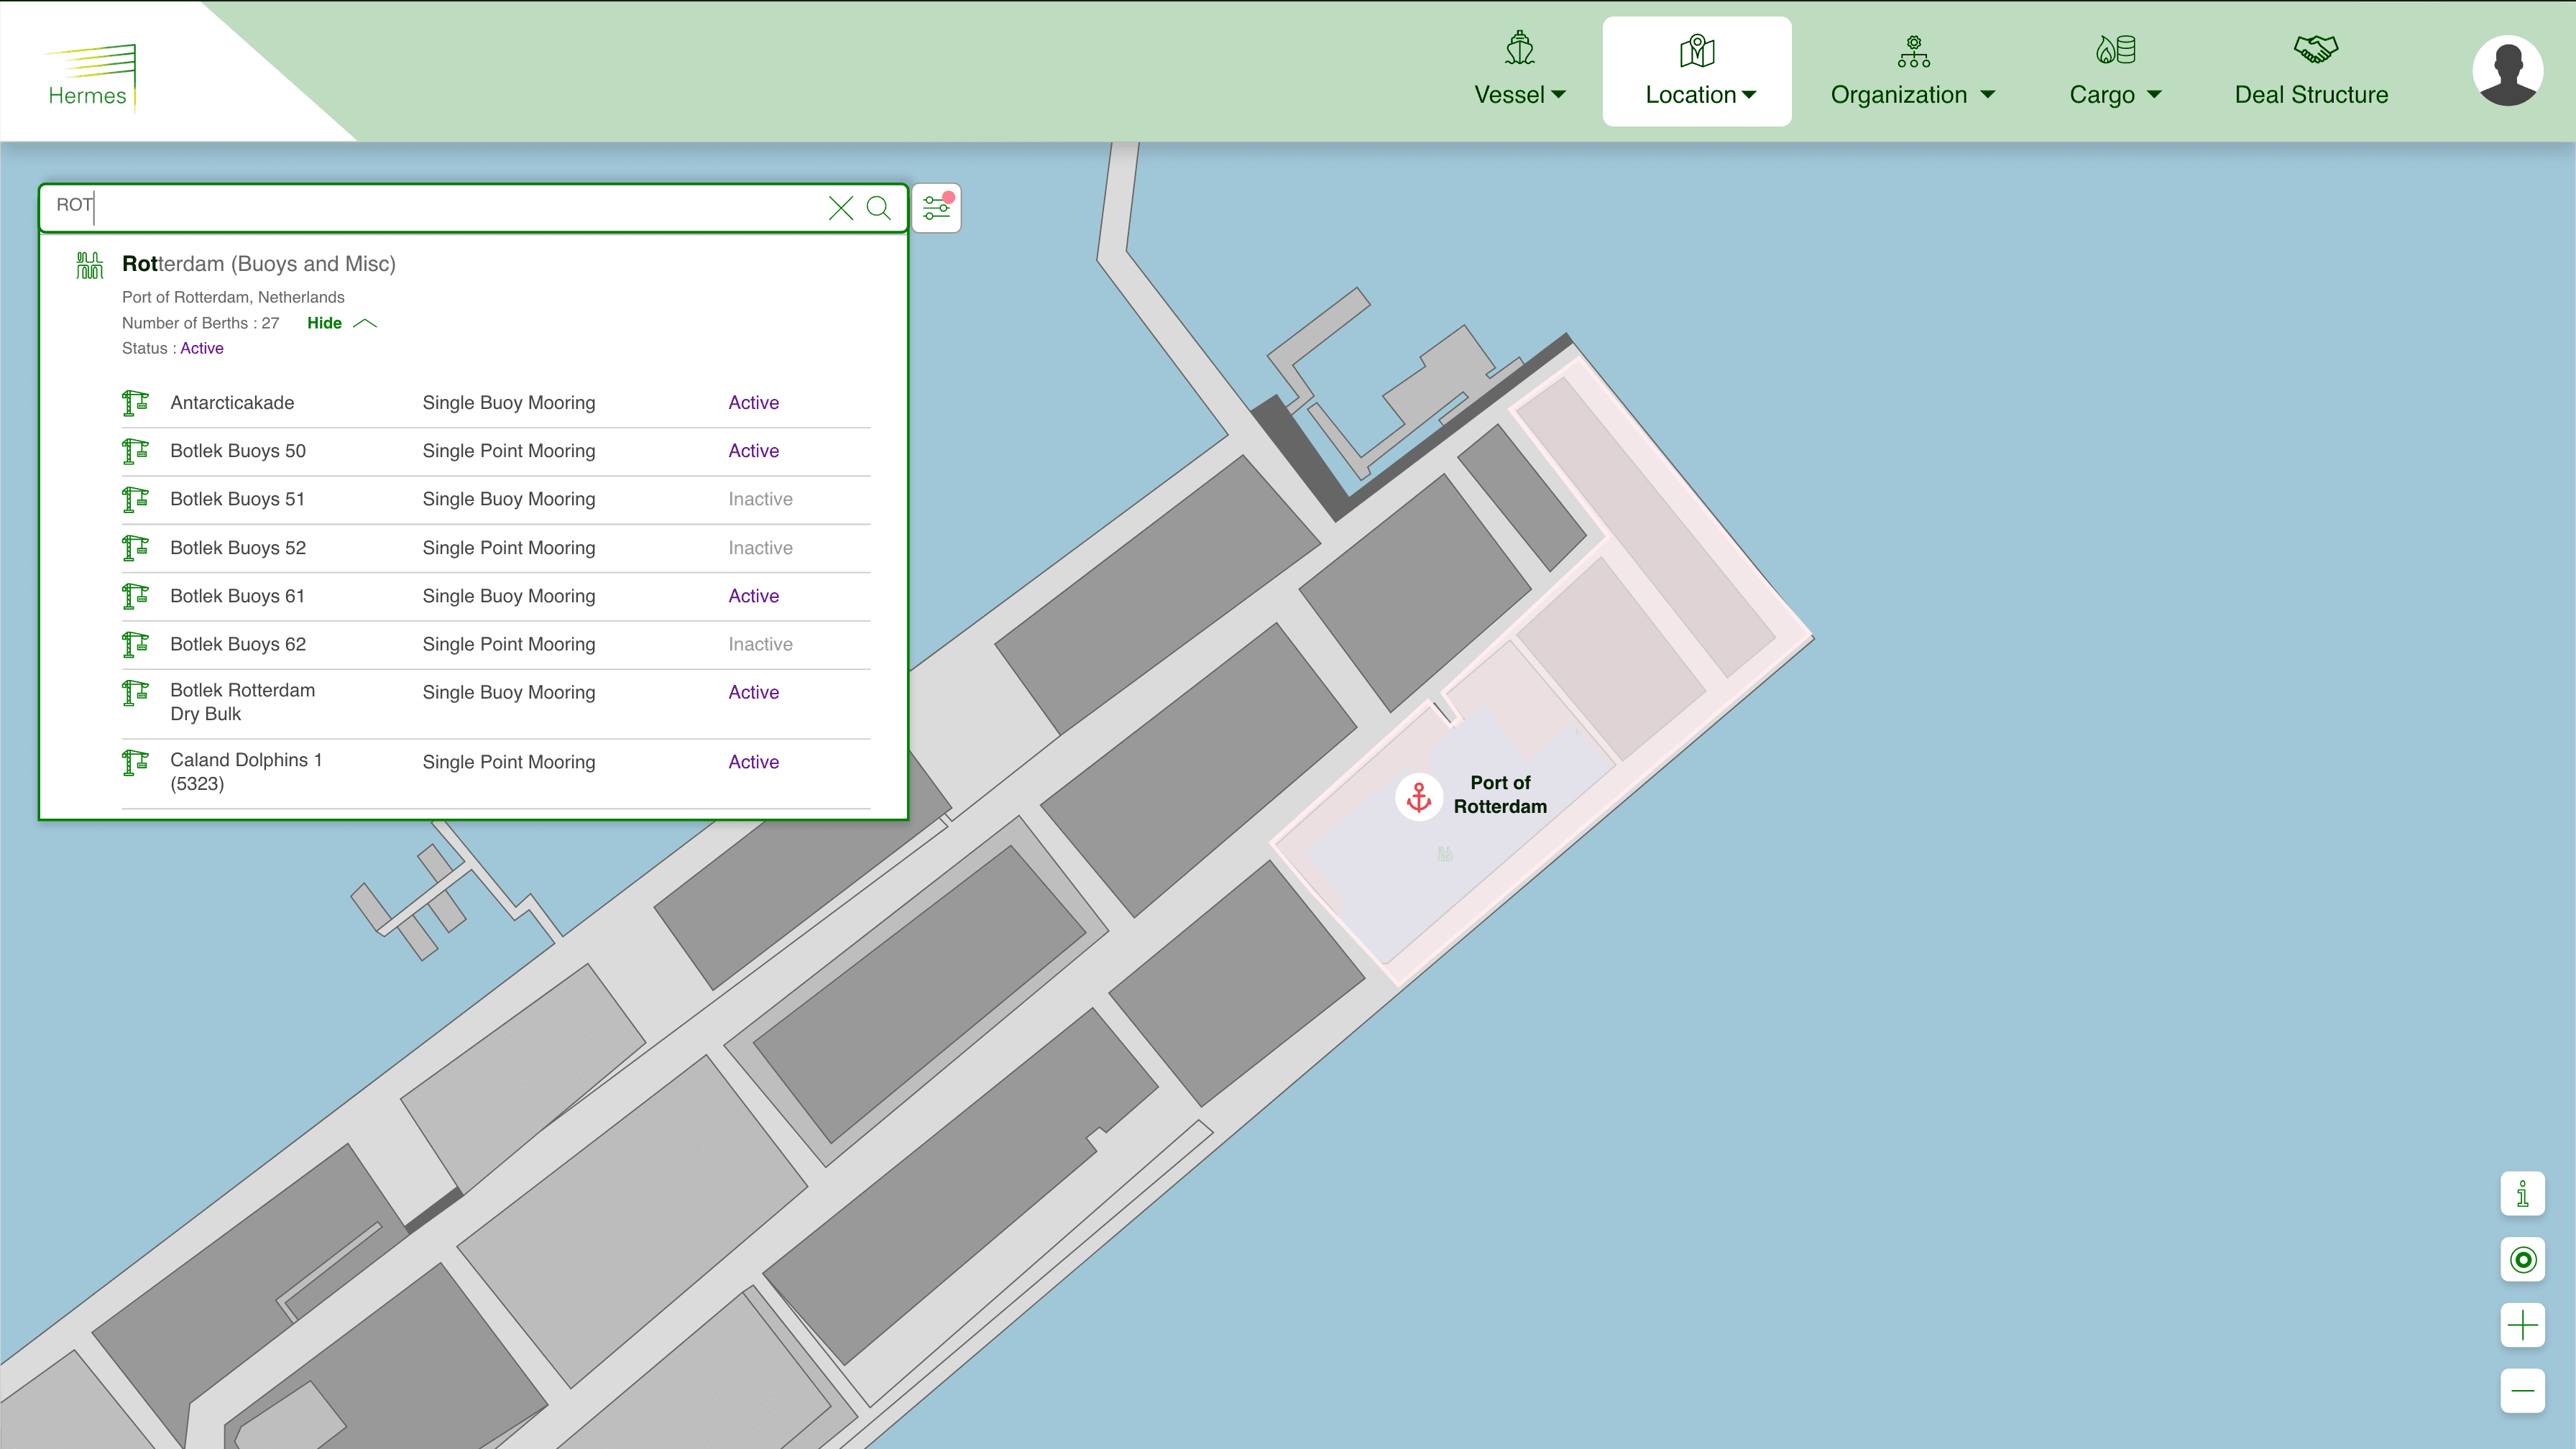
Expanded dropdown to view hierarchy
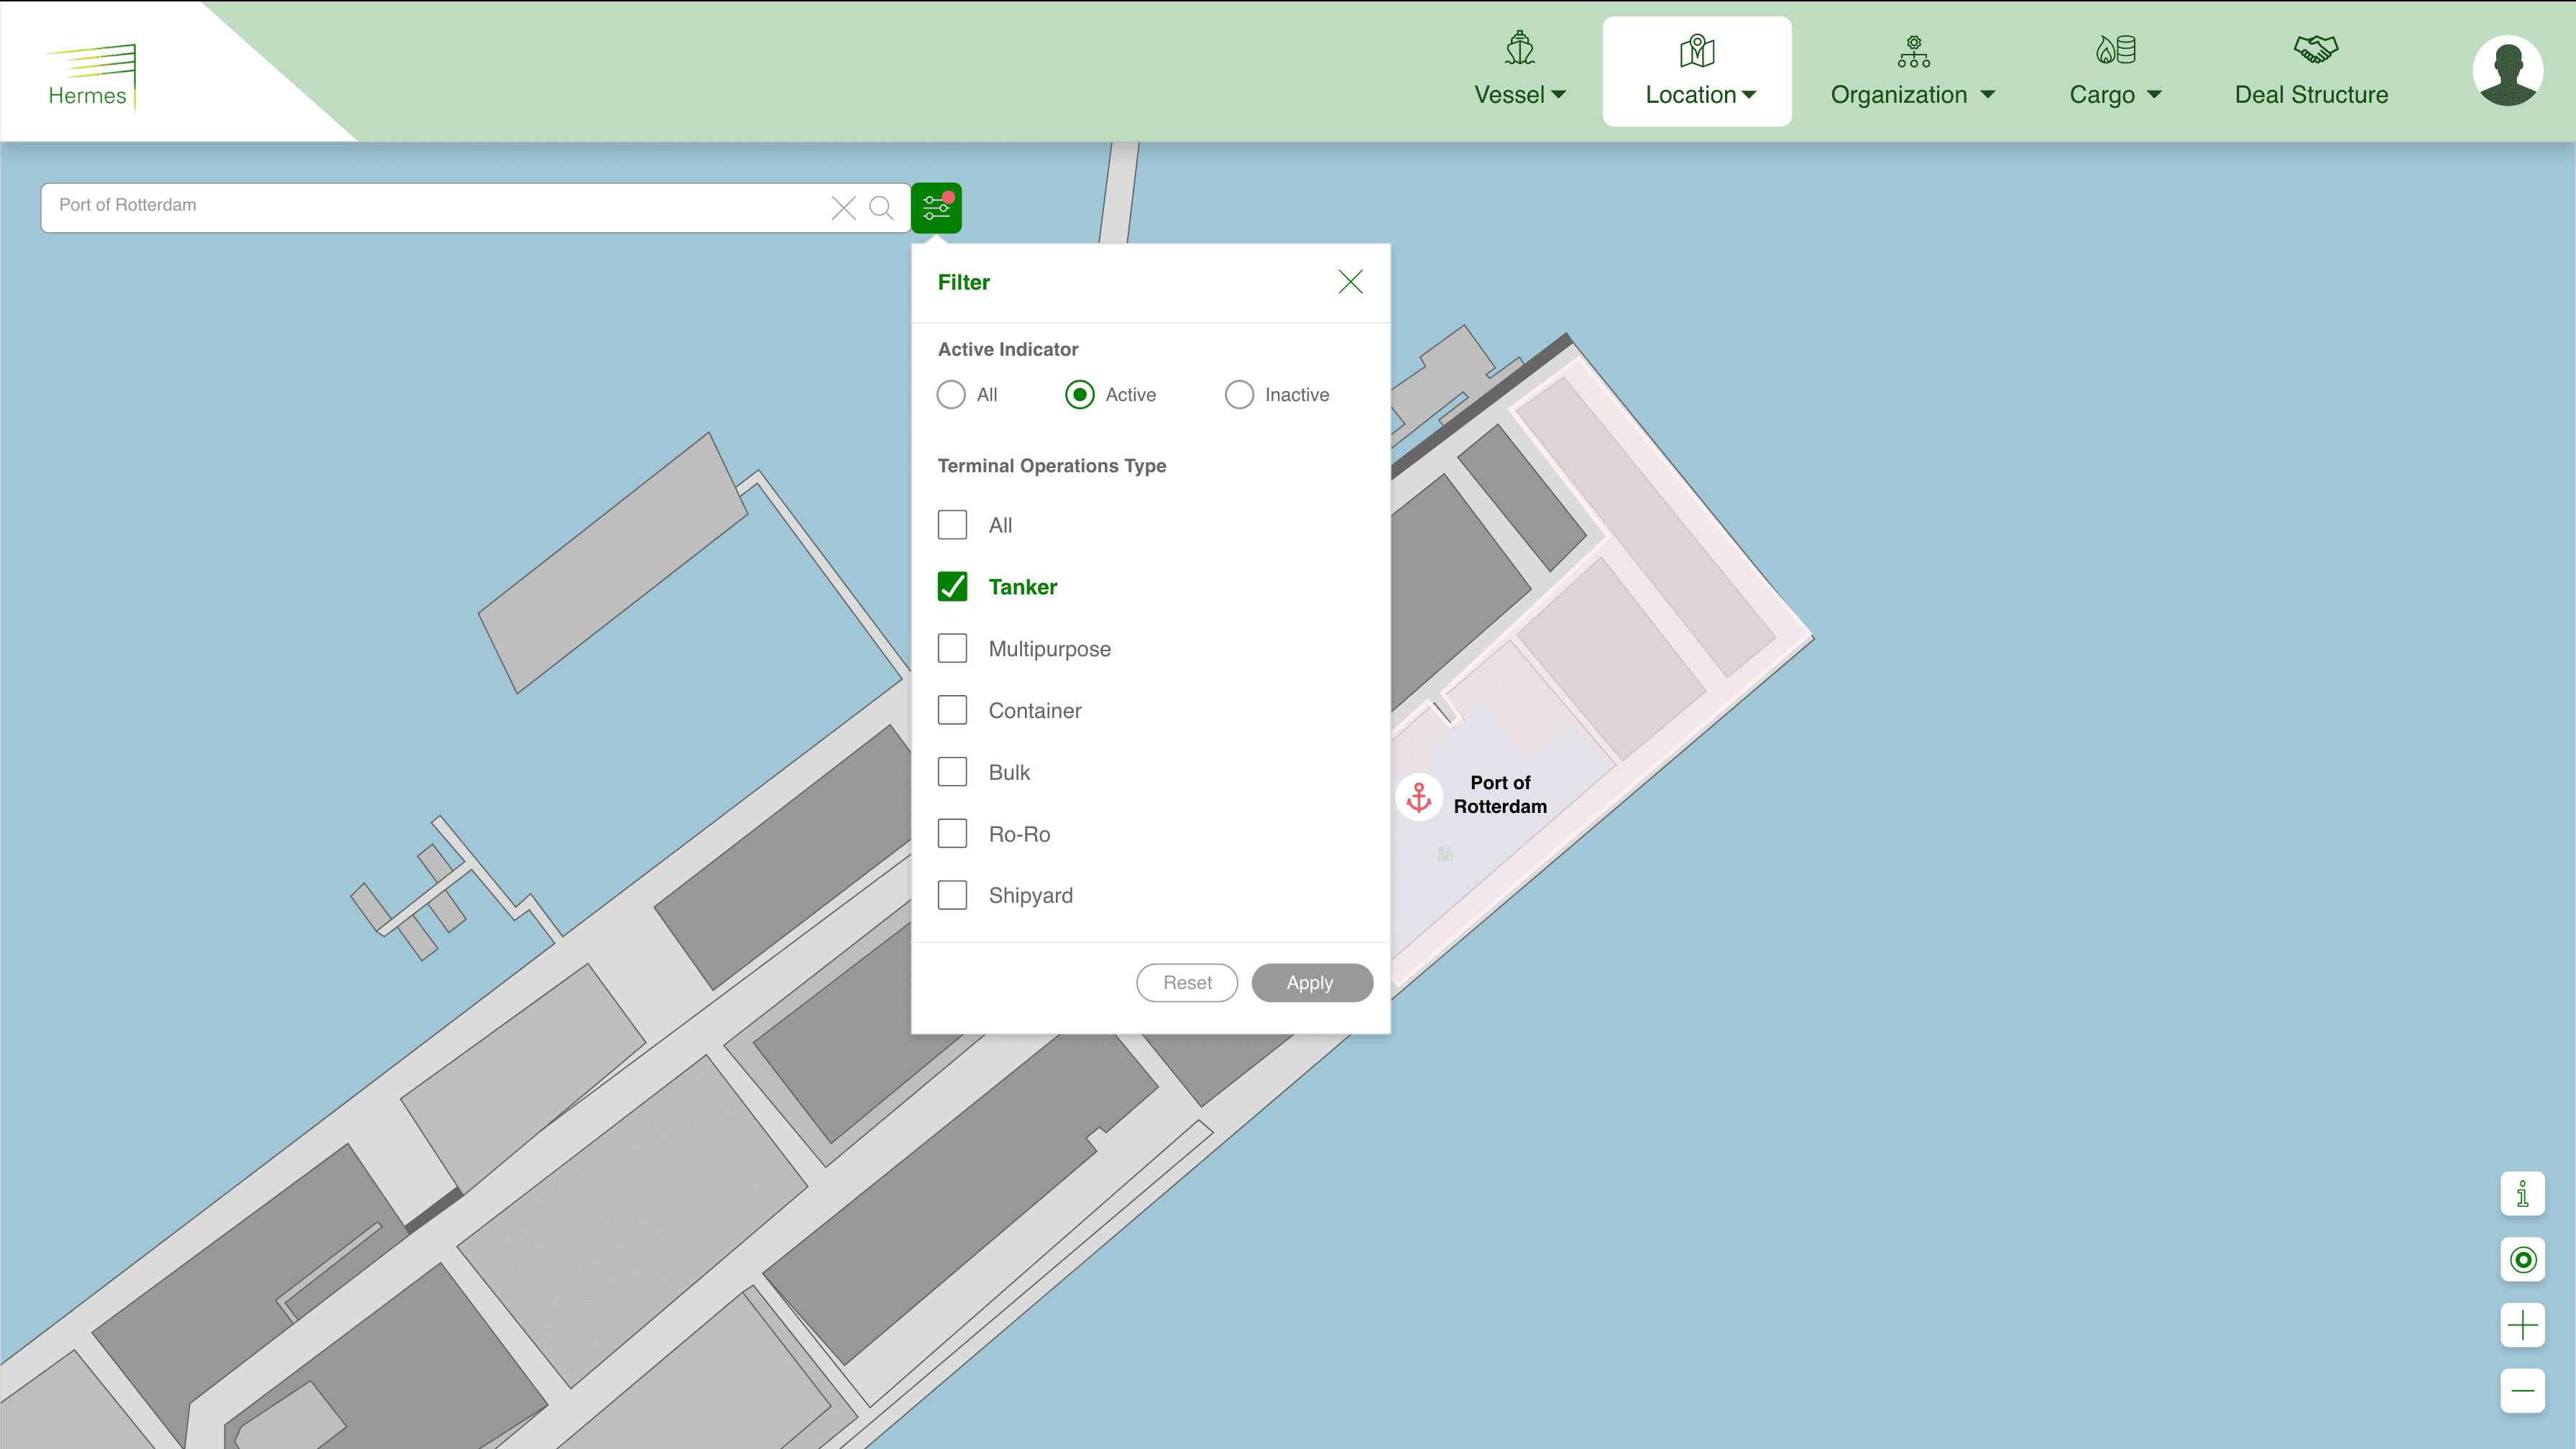
Filter to narrow down user's search results
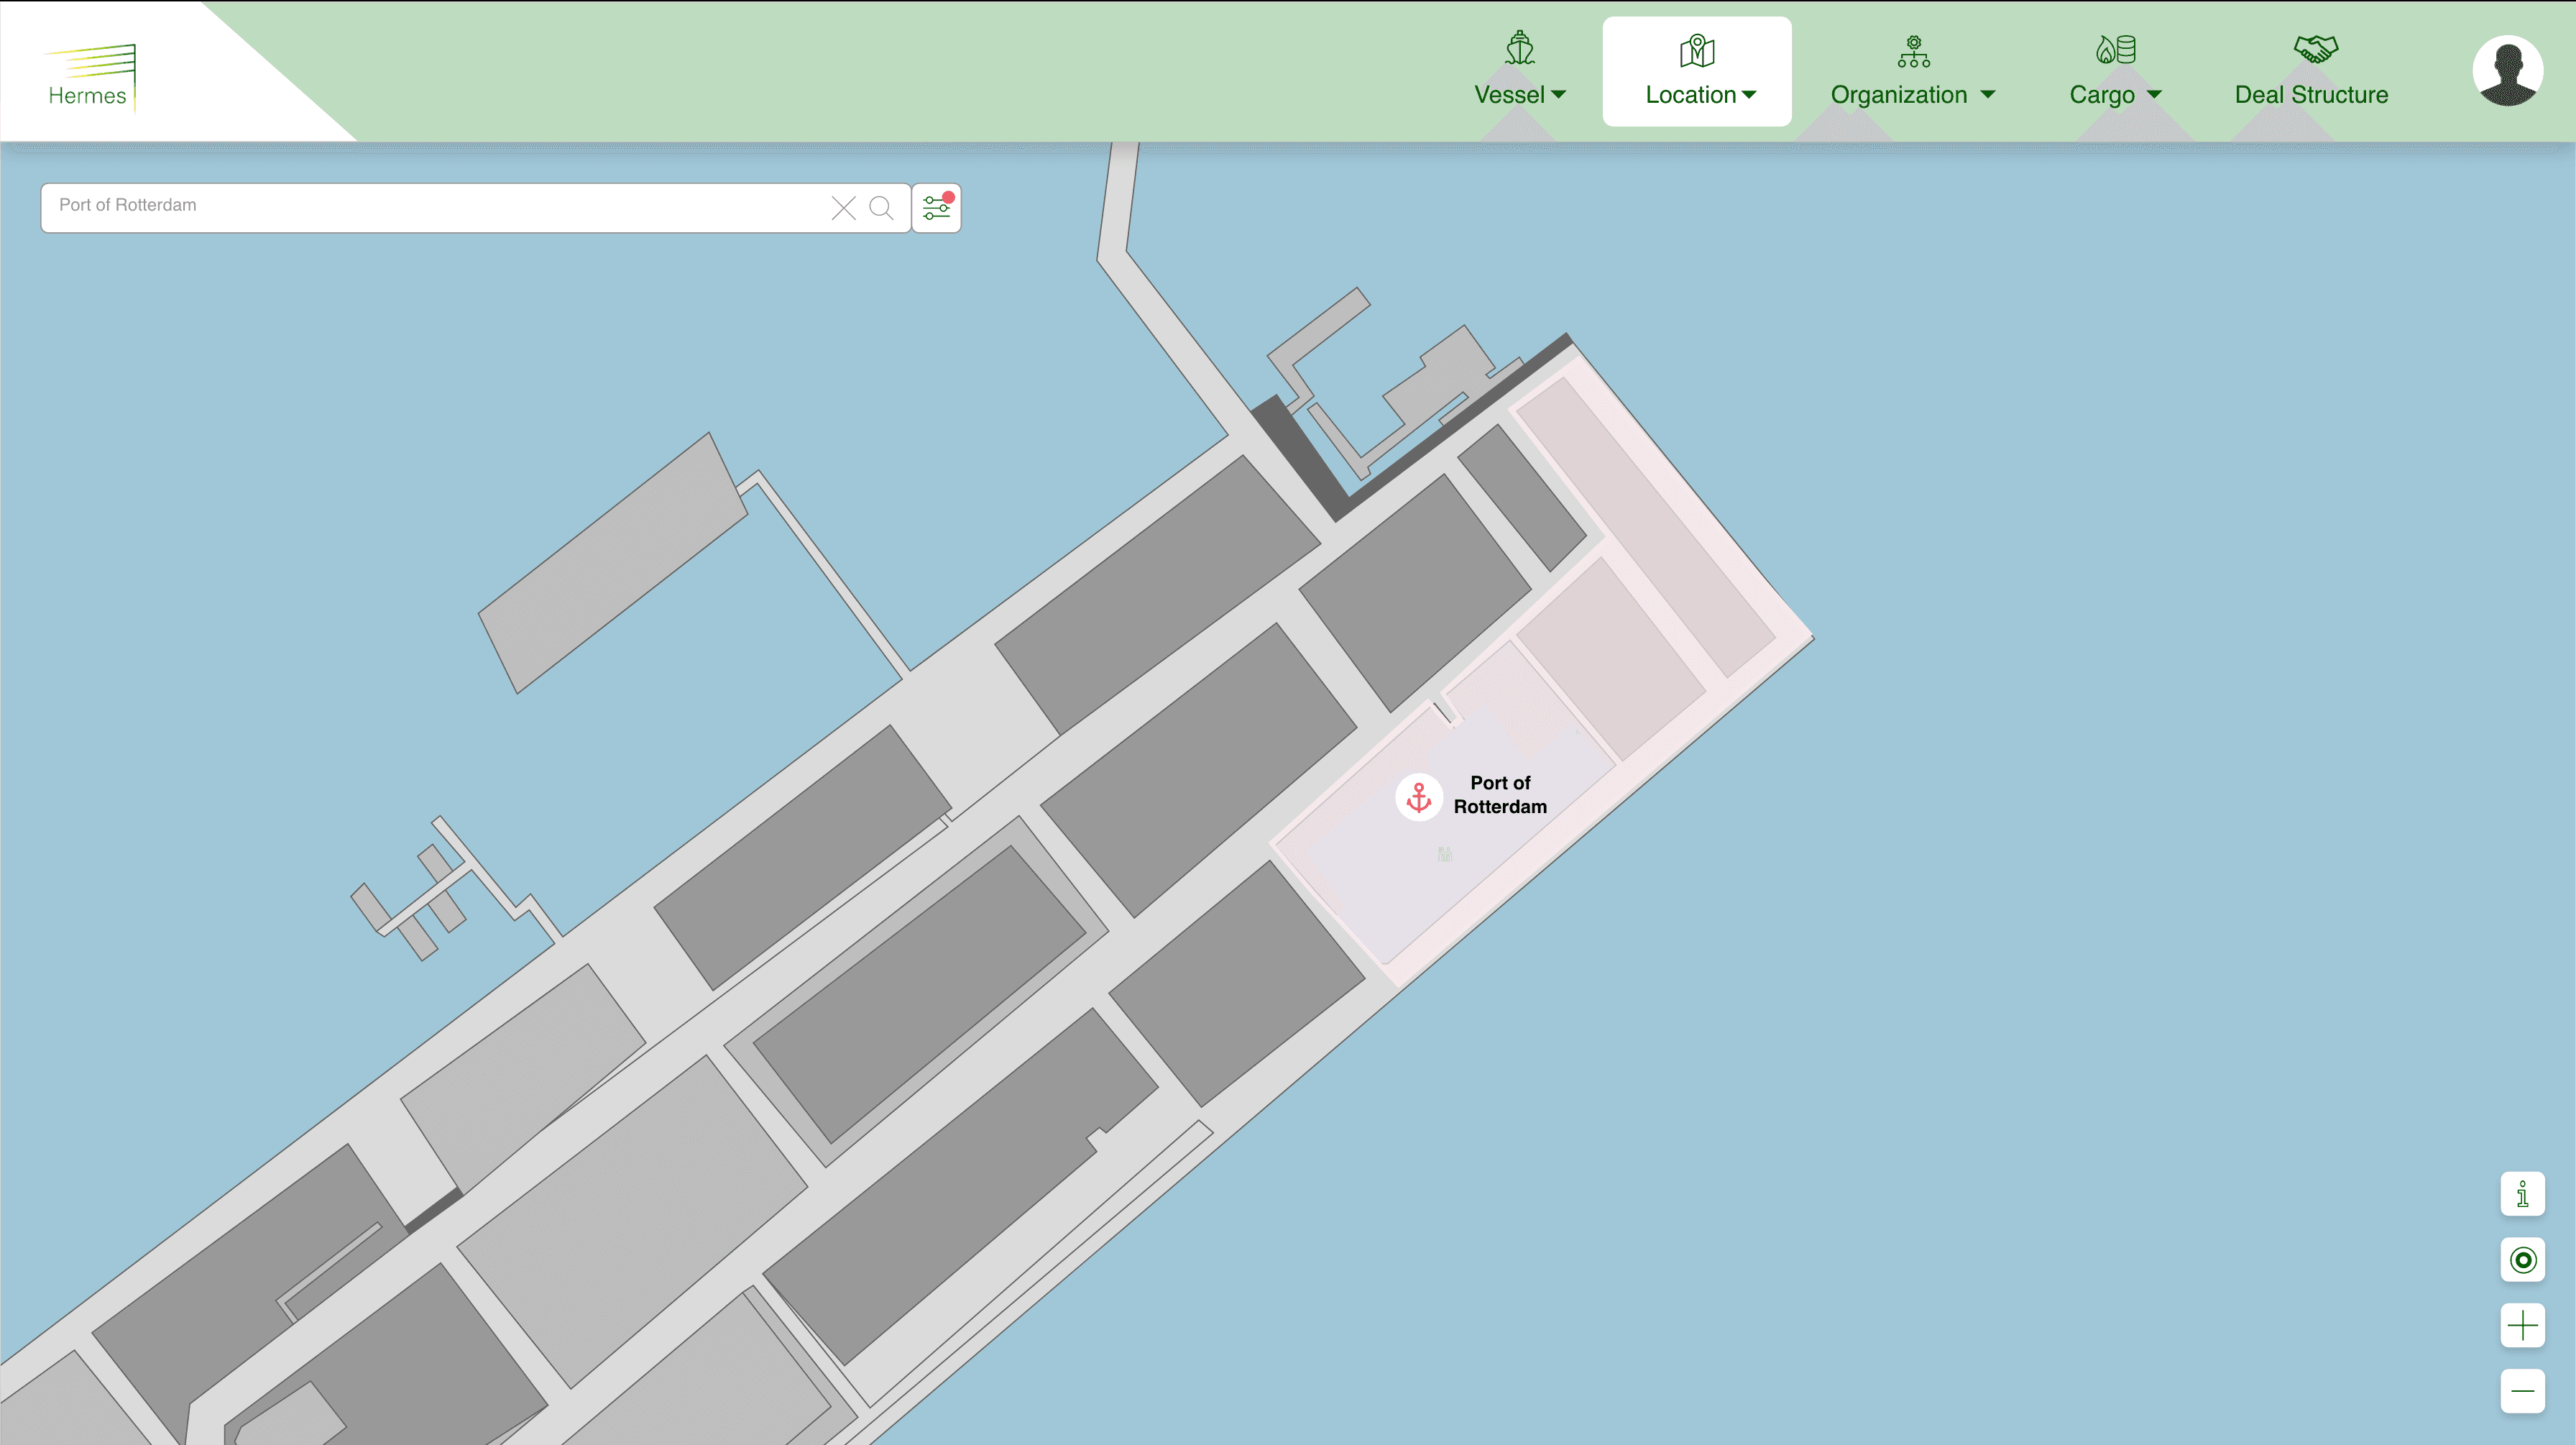
Plotted search result on map

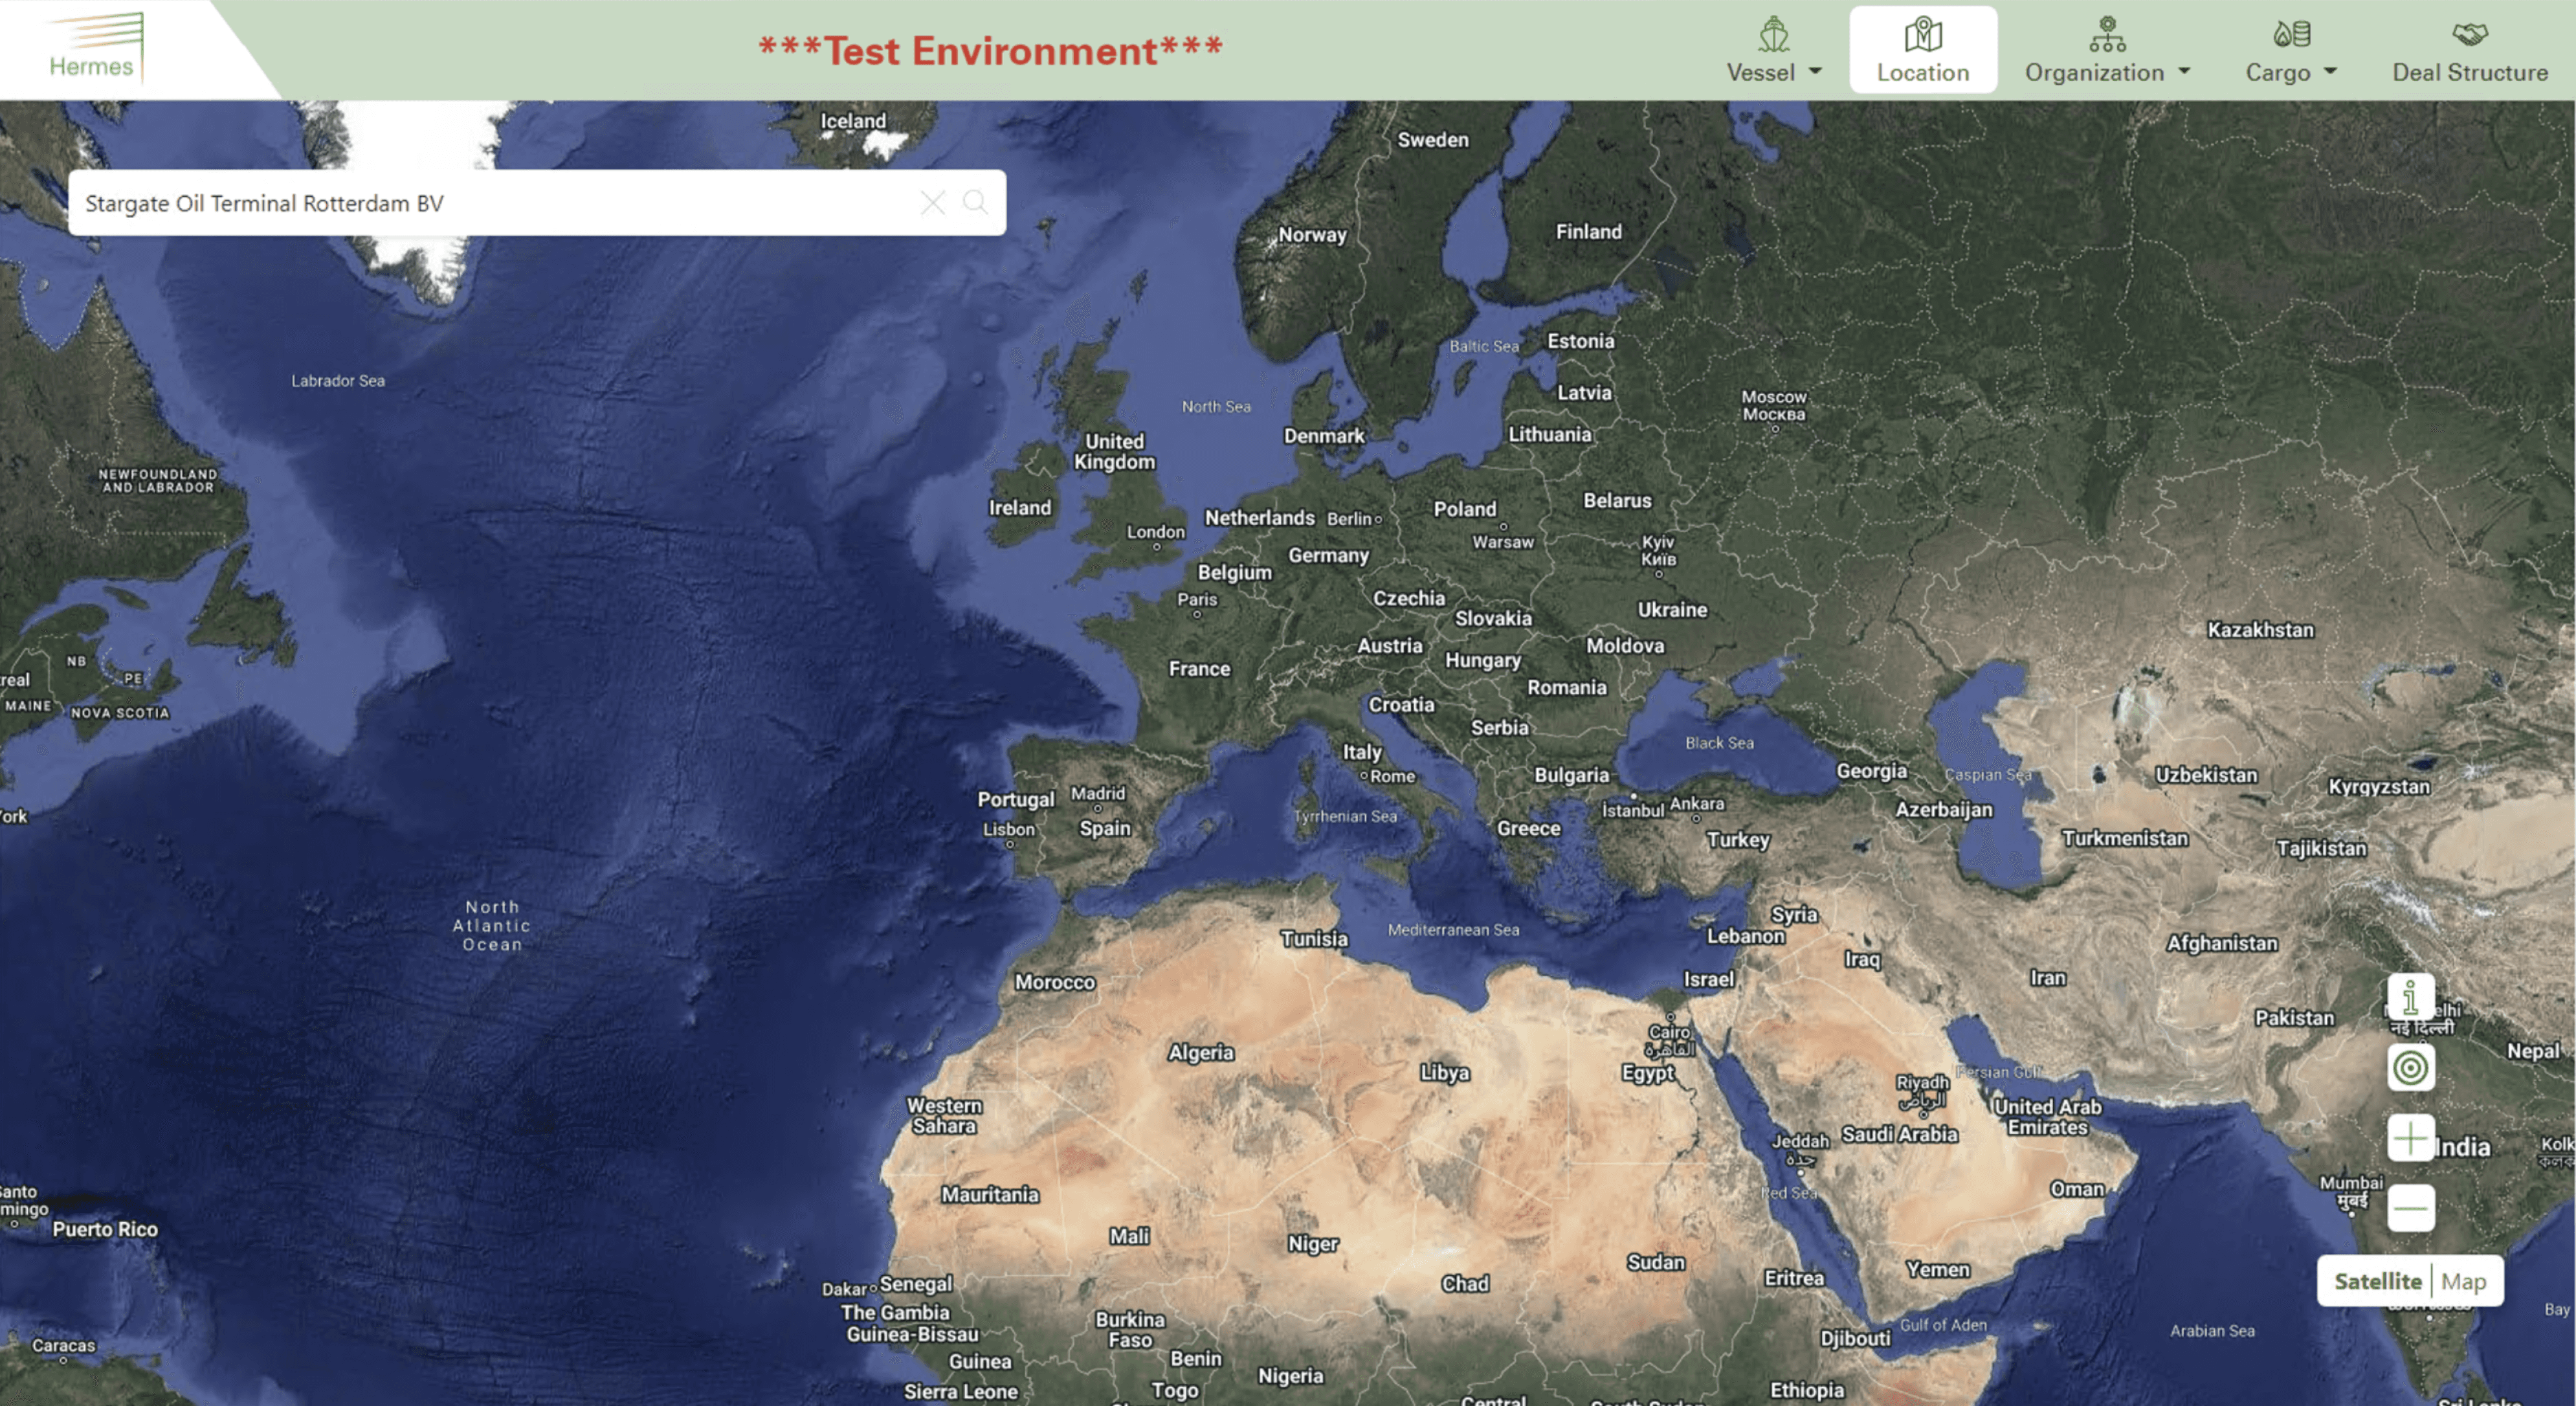
Location Search screen developed for test environment
Users navigate to the ‘Locations’ section of the homepage
At first, they have a view of the entire world map loaded on the screen, dropping the pin precisely at their current location
A search bar is provided to search for specific Ports, Berths and terminals
A filter allows you to narrow down your search, and provide results that interest the user
Active/Inactive locations / Type of locations are some of the filters
The dropdown that appears after interacting with the search bar, is a detailed dropdown and varies according to the location type.
Specific details are mentioned for each of the Port, Terminal, Berth.
After clicking on the option the users wish to view, the area is plotted on the world map with a differentiation for the Location Type (Port, Terminal or Berth)
Users can draw polygons / linear points to measure an area / distance on the map directly
Latitude and Longitude dynamic bar would update as and when the user moves their cursor
Navigation, Plotting & Measuring on the Map
User Flow
Users can also view the hierarchy of the location within the dropdown
Location details, viewing of hierarchy, and setting status of the location
Area is plotted on the world map with a differentiation for the Location Type (Port, Terminal or Berth)
On hover of the plotted location, users can view additional details that are necessary for a quick glance.
They can navigate to the Location detail screen by clicking on the CTA provided in the hover
Attributes, restrictions, documents, climate can be viewed & edited on the details screen
Using the left panel hierarchy of the searched location, users can navigate easily between Ports / Terminal / Berth
Setting status to Active / Inactive
User Flow
User Flow
Adding a new location
The ability to add a new location is present in the header from the dropdown designed for Locations
Clicking on Add New Location, users will navigate to a screen where they can enter information related to the location
Tabs are present to differentiate the Port / Terminal / Berth form inputs
Clicking on ‘Submit’ allows the user to create the location
The request is sent for approval
In case of duplication, the application throws a pop-up to display the matching results found in the system
Once approved, when the User logs in to the application, they can directly search for the newly added location and view the plotted area on the map
User can check the same and can either continue to create or cancel the request entirely
Information Architecture
Header - Location
Landing Screen - Search for locations around the world
Add Location
Advanced Search
Search Bar
Latitude / Longitude dynamic bar
Filter
Port
Details / Inputs
Facility Type
Criteria
Parameter
Input Field - Search / Dropdown Selection
Operators
Input Fields
Remove Parameter
Reset
Show Results CTA
Result Screen
Search
Facility Type
Manage Columns
Search Parameter
Add / Remove Parameter
Apply / Reset
Name
ID
Associated Country
Associated Port
Unlocode
Alternate Port Name
Associated Terminal
Restrictions
Export to Excel
Collapse / Expand Columns
Grid
Port
Terminal
Berth
Terminal
Berth
Submit
Duplicate Check
Override
Cancel
Zoom In / Zoom Out
Reset to target
Measure
Information - Legend
Plot points
Result Dropdown
Active / Inactive Status
Terminal Operations Type
Port
Area Plotted on Map
Area Plotted on Map
Area Plotted on Map
Status
Hierarchy
Hierarchy
Hierarchy
Status
Status
Alternated Name
Attributes
Attributes
Attributes
Country
Attachments
Attachments
Attachments
Country
Country
Timezone
Set Status
Set Status
Set Status
Active / Inactive
Active / Inactive
Active / Inactive
Upload
Upload
Upload
View
View
View
Edit
Edit
Edit
Email data provider
Email data provider
Email data provider
View
View
View
Port
Port
Lat / Long
Comparison of locations with iMAS
Comparison of locations with iMAS
Comparison of locations with iMAS
Audit
Port
Terminal
Berth
Viewing Available Agents
Around the year probability
Comment by Agent
Rule
Rule
Rule
Audit
Audit
Restrictions
Climate
CTA to Submit changes
CTA to Submit changes
CTA to Submit changes
Lat / Long
Lat / Long
No. of Terminals
No. of Berth
Berth Manual
UNLOCODE / Alias
Port Manual
Terminal Manual
Terminal
CTA - View Details
CTA - View Details
CTA - View Details
Alternate Name
Port
Terminal, Port
UNLOCODE
No. of Terminals
No. of Berths
Berth Type
Status
Status
Status
Hierarchy
Hierarchy
Terminal
Berth
Measure distance
Measure area
Measure Perimeter
An elaborate IA to understand the Location Module
Research
Looking at multiple open sources that allows certain functionalities that the users demanded.
Understanding the technical limitations with building a world map navigator vs utilising a version fo an existing map eg. google, bing, etc.
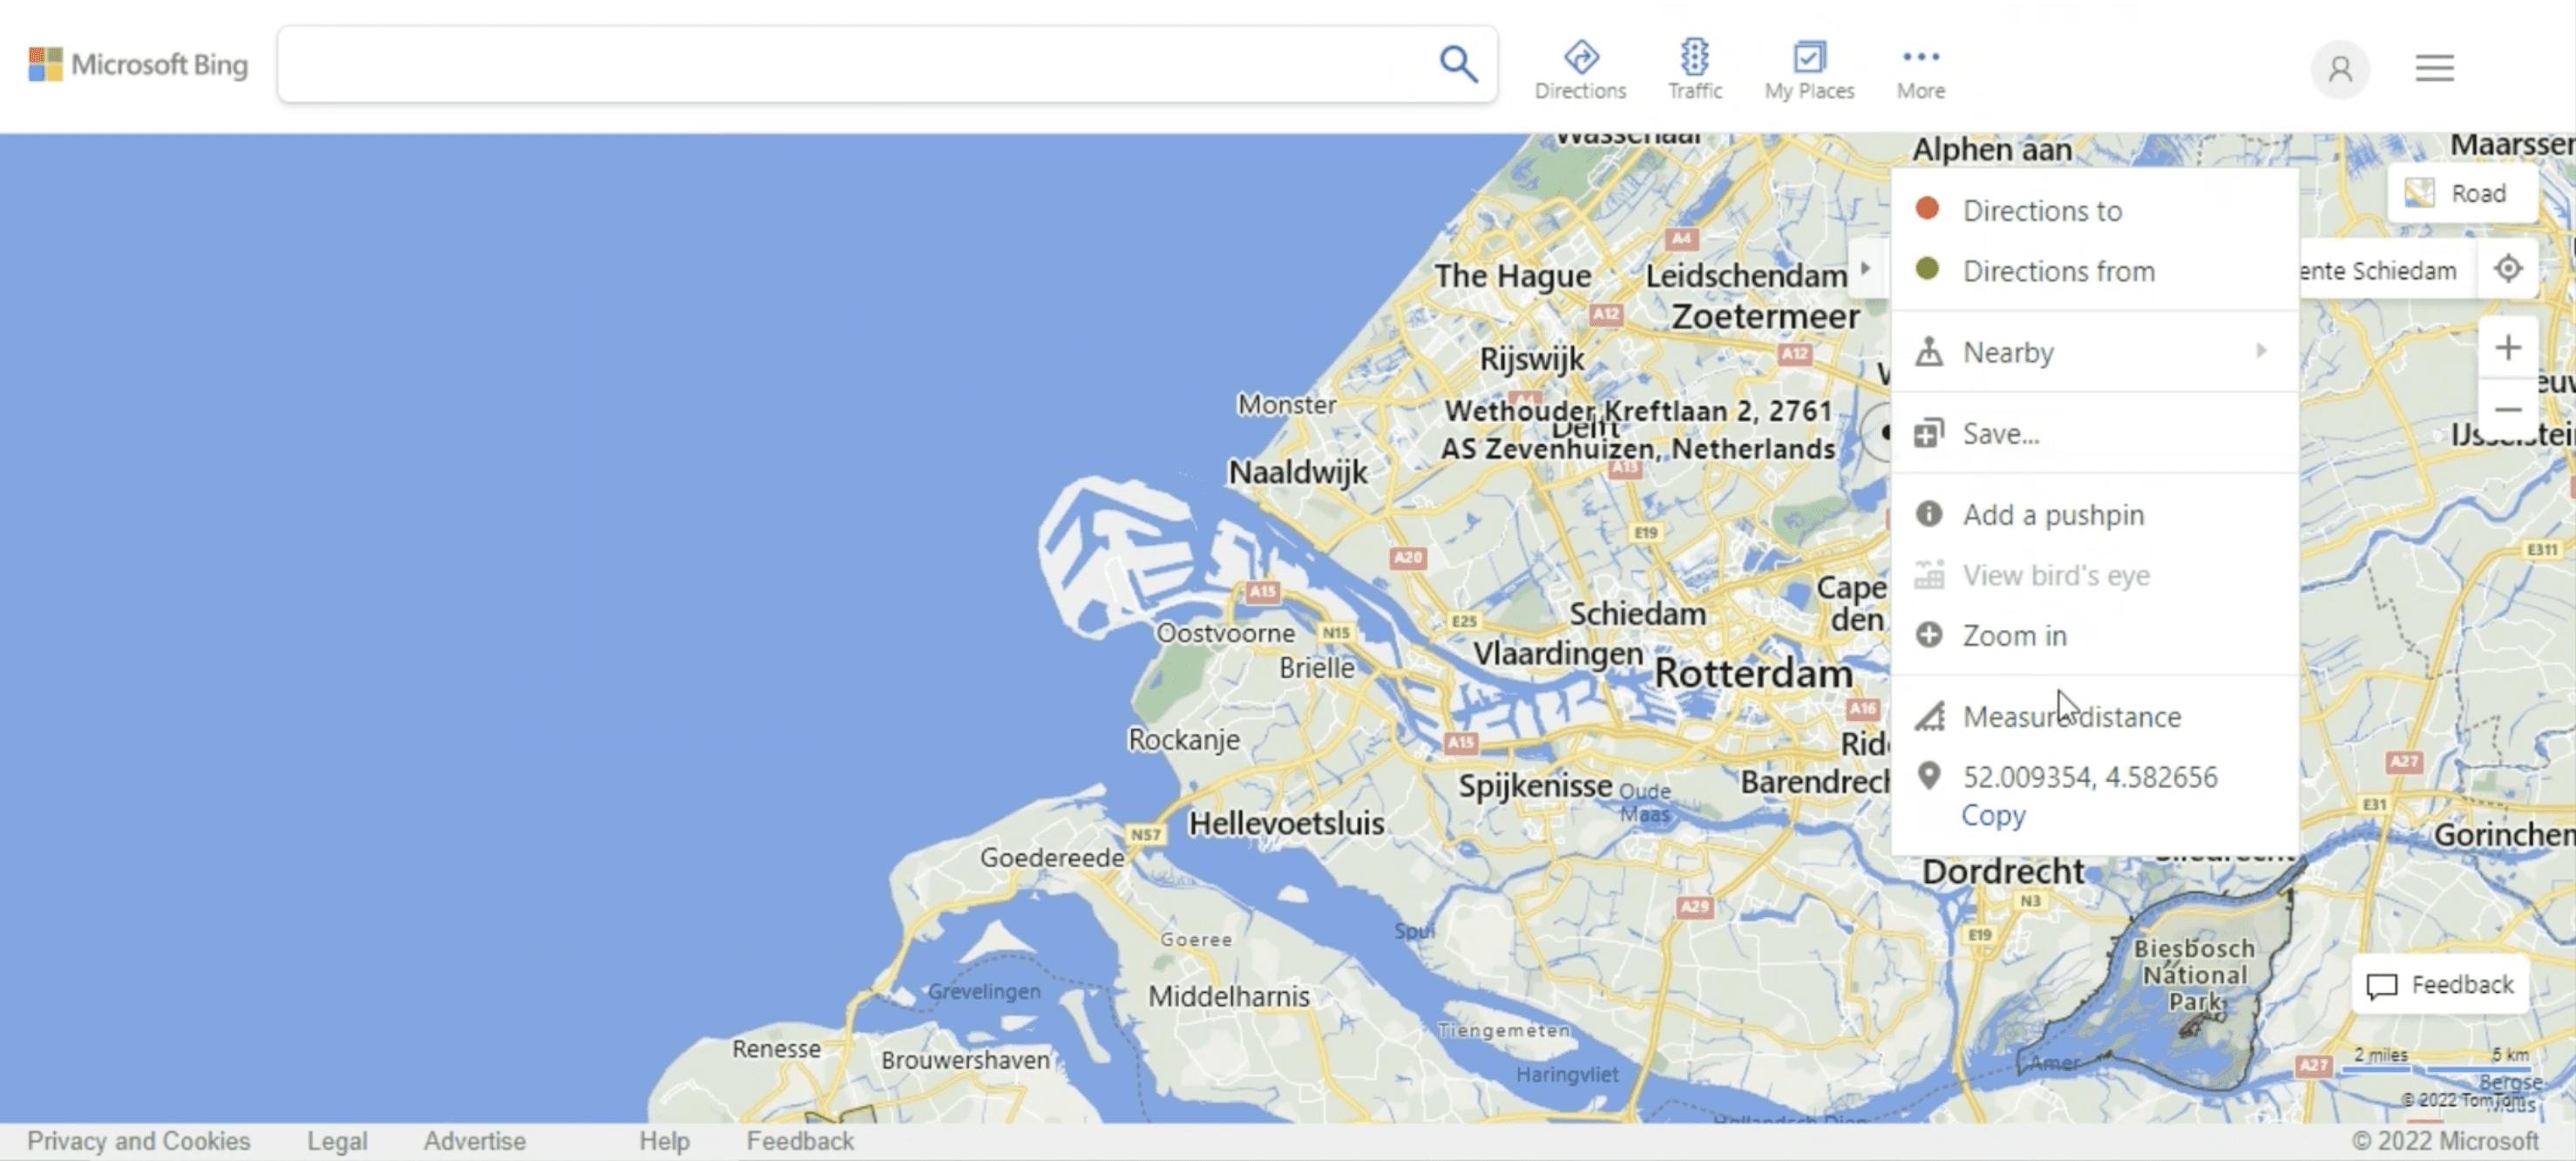
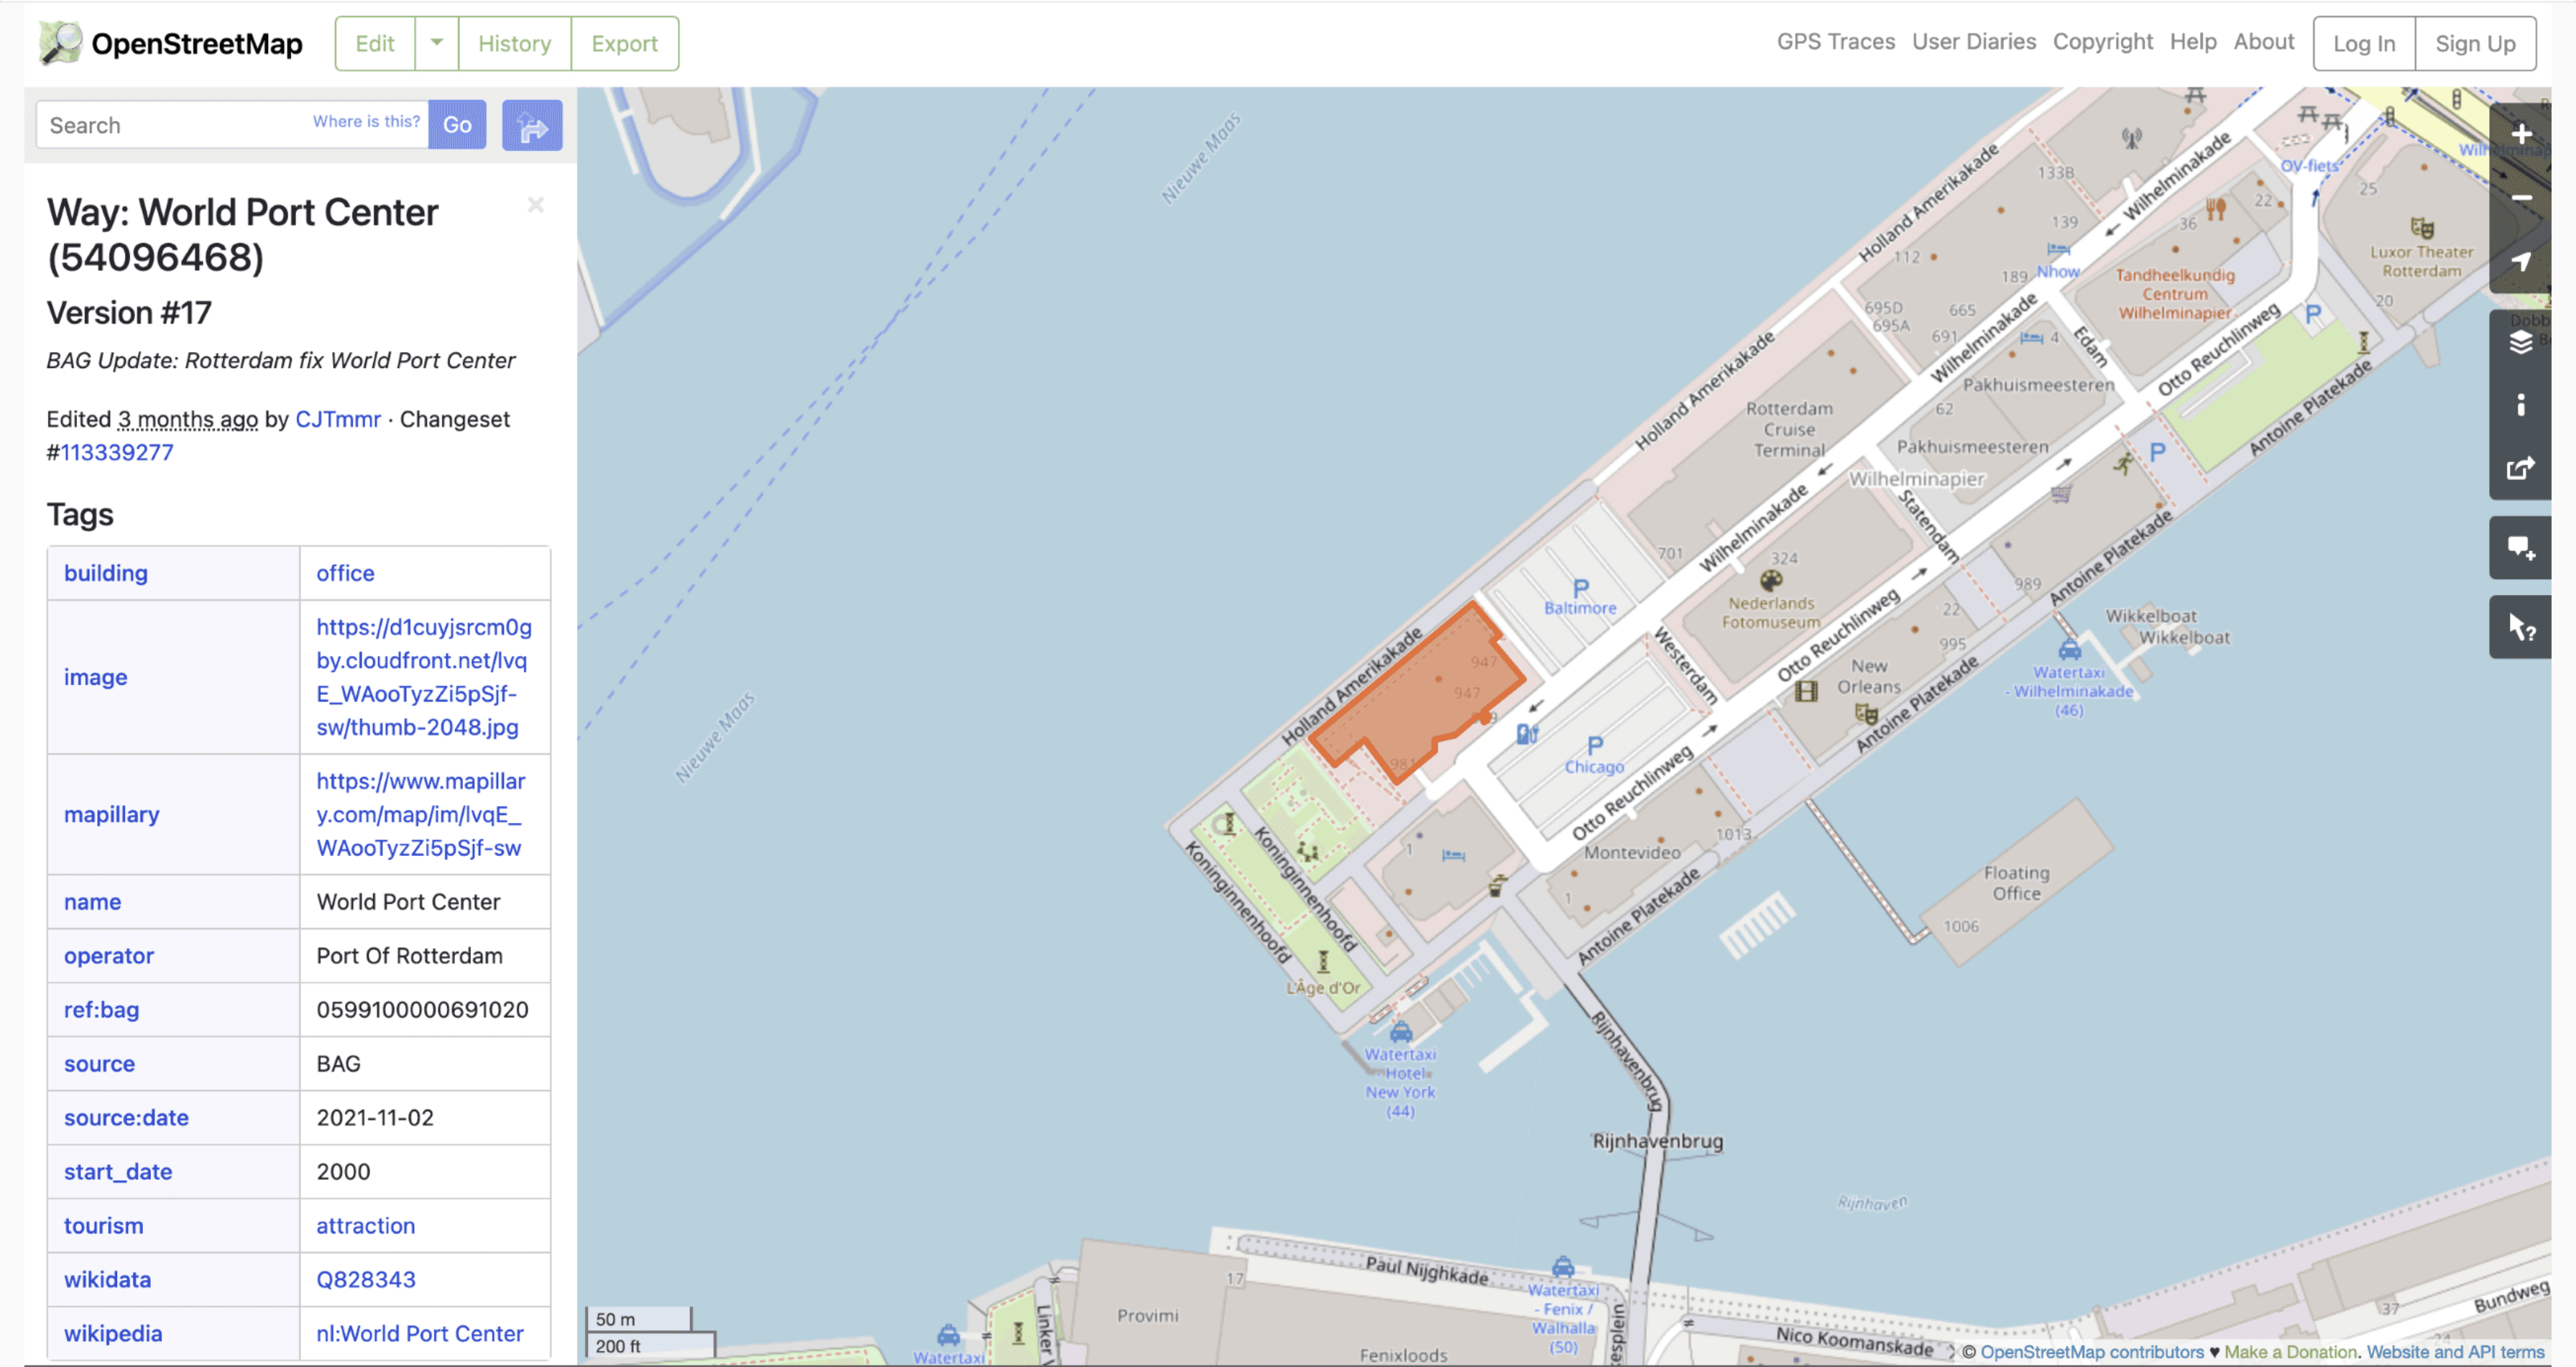
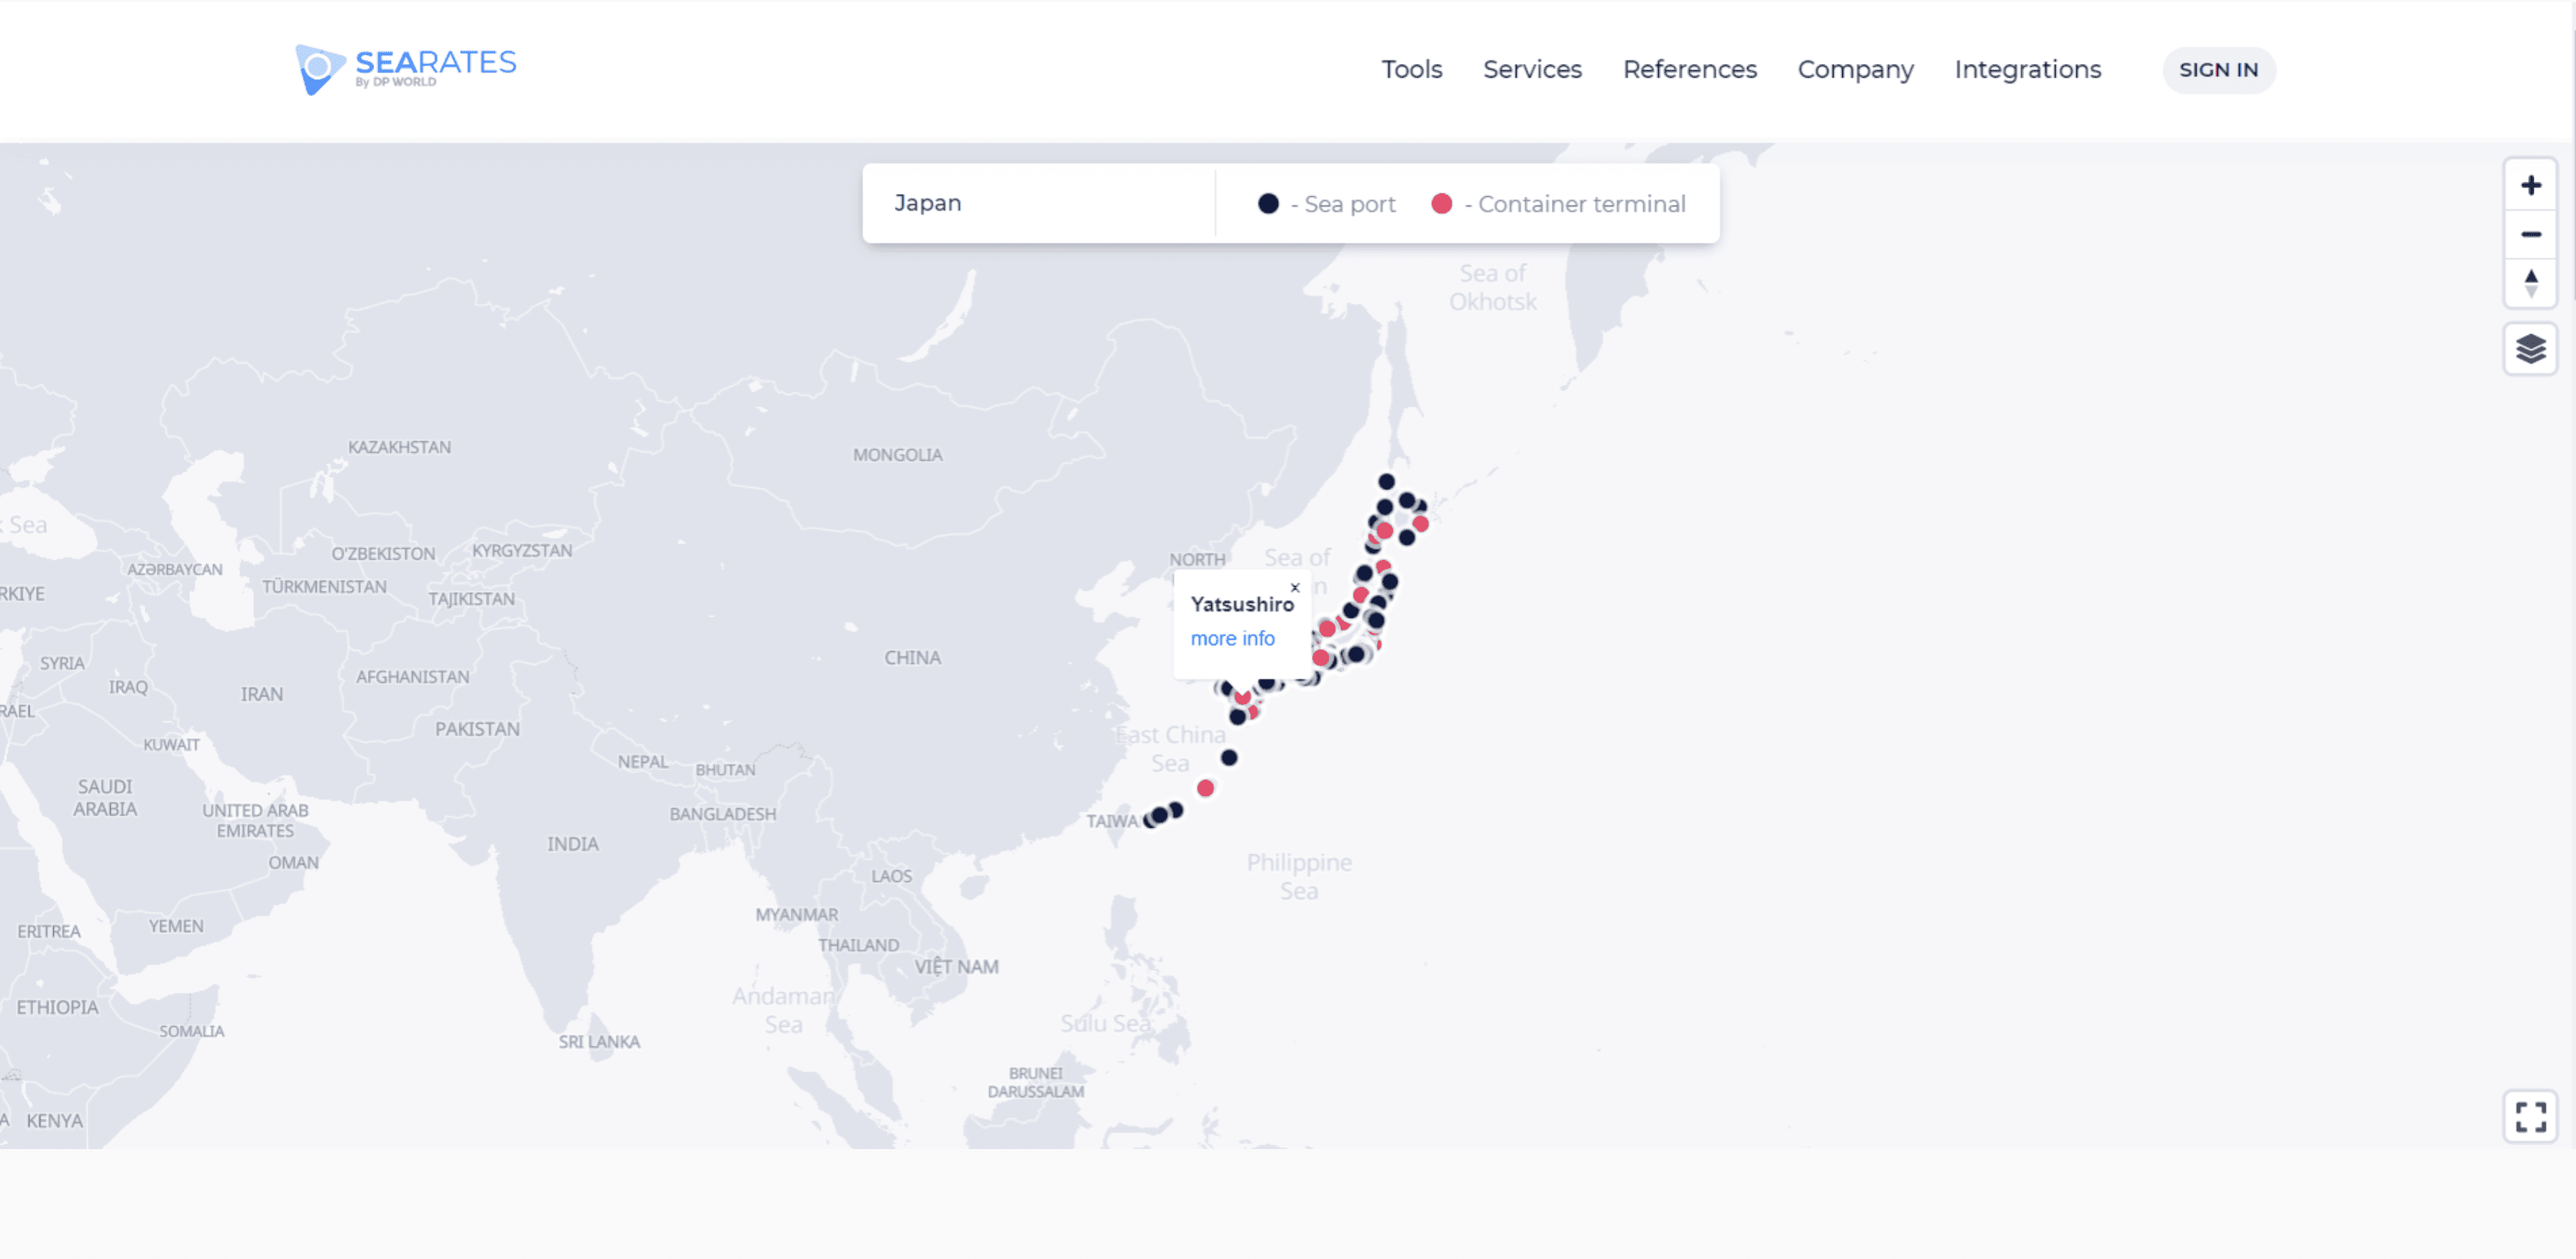
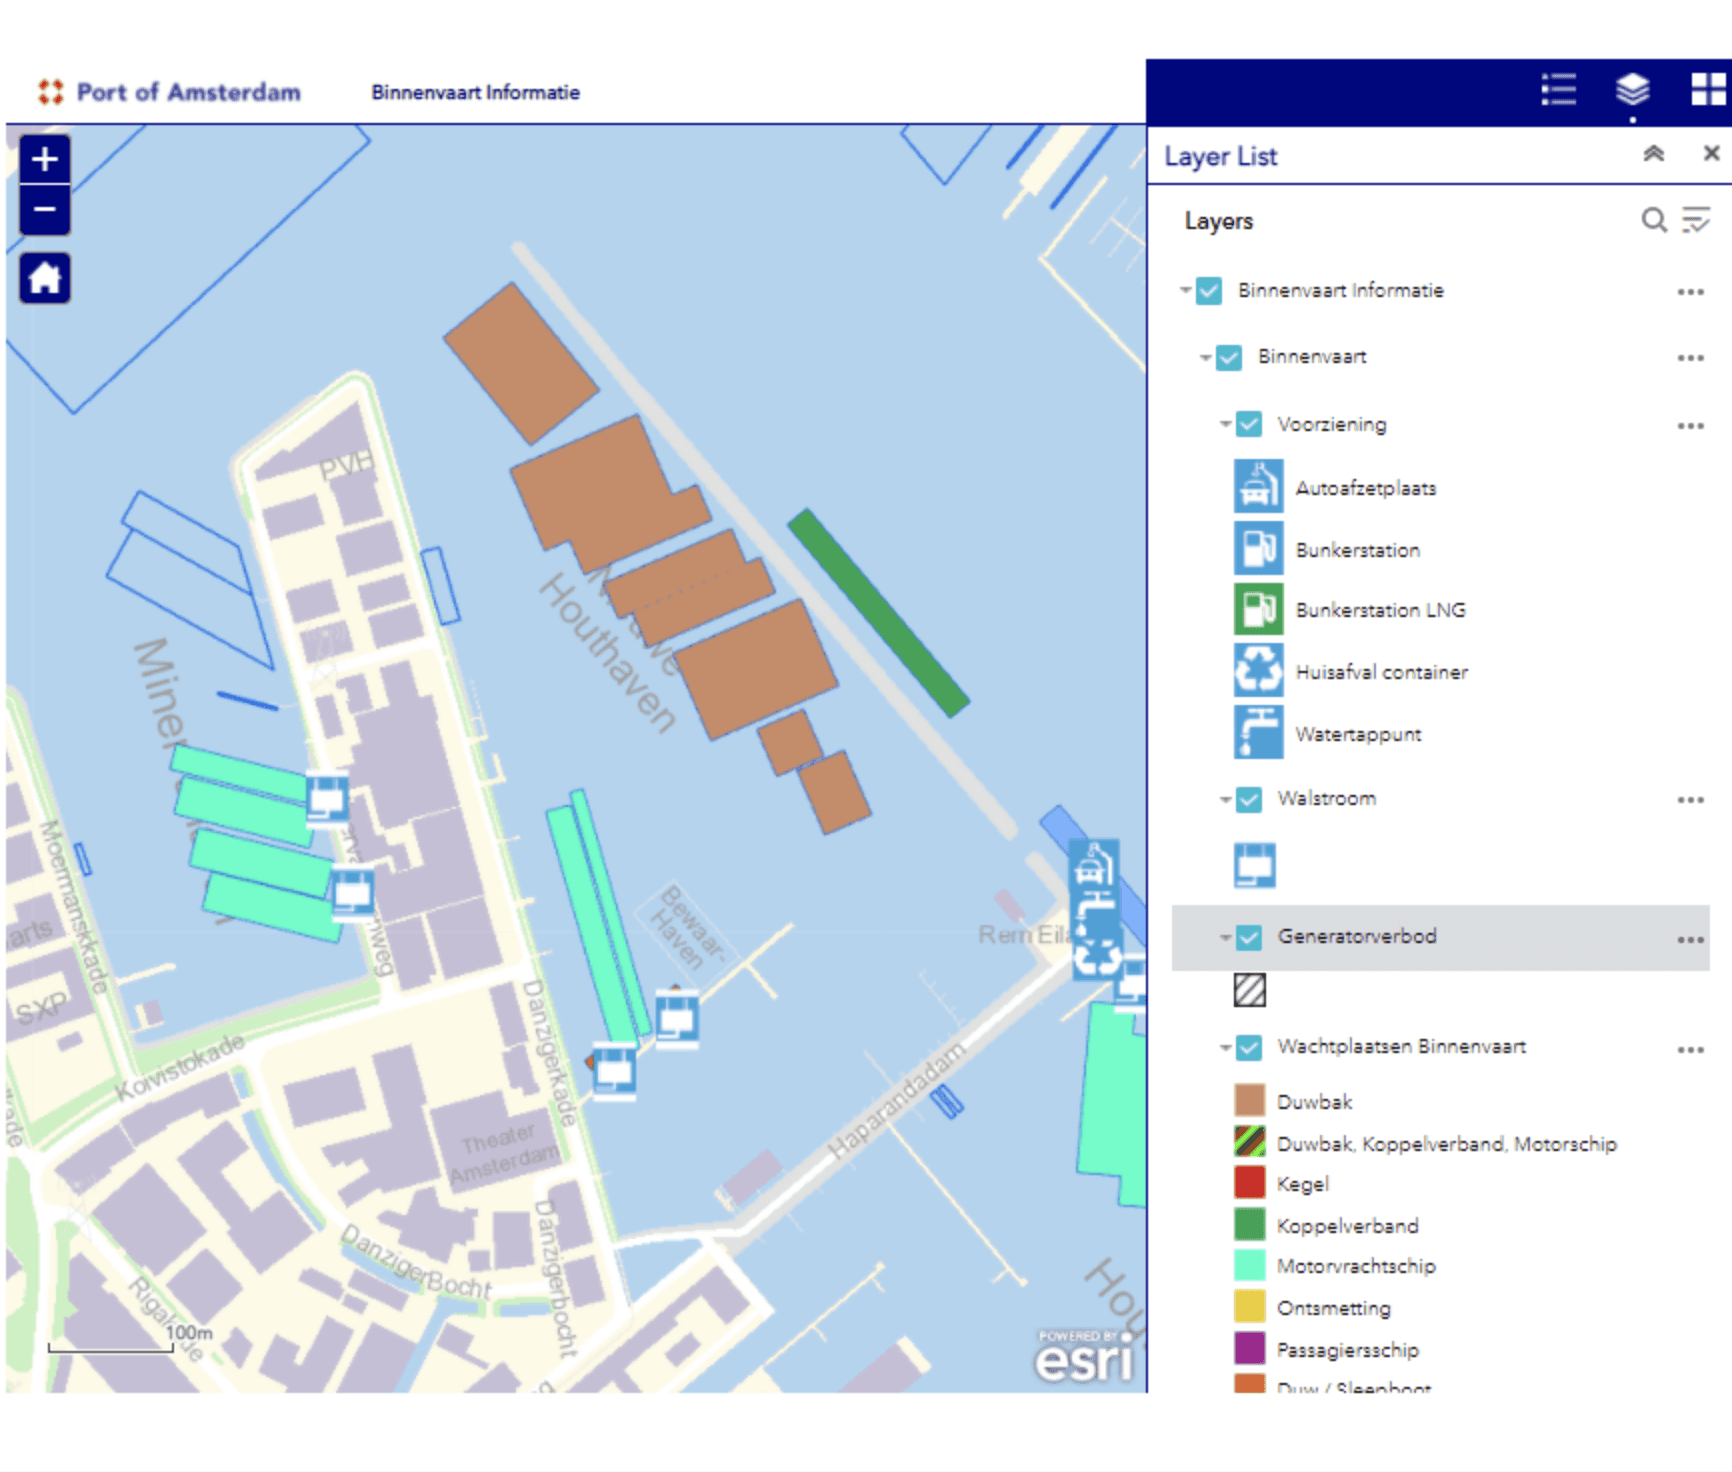
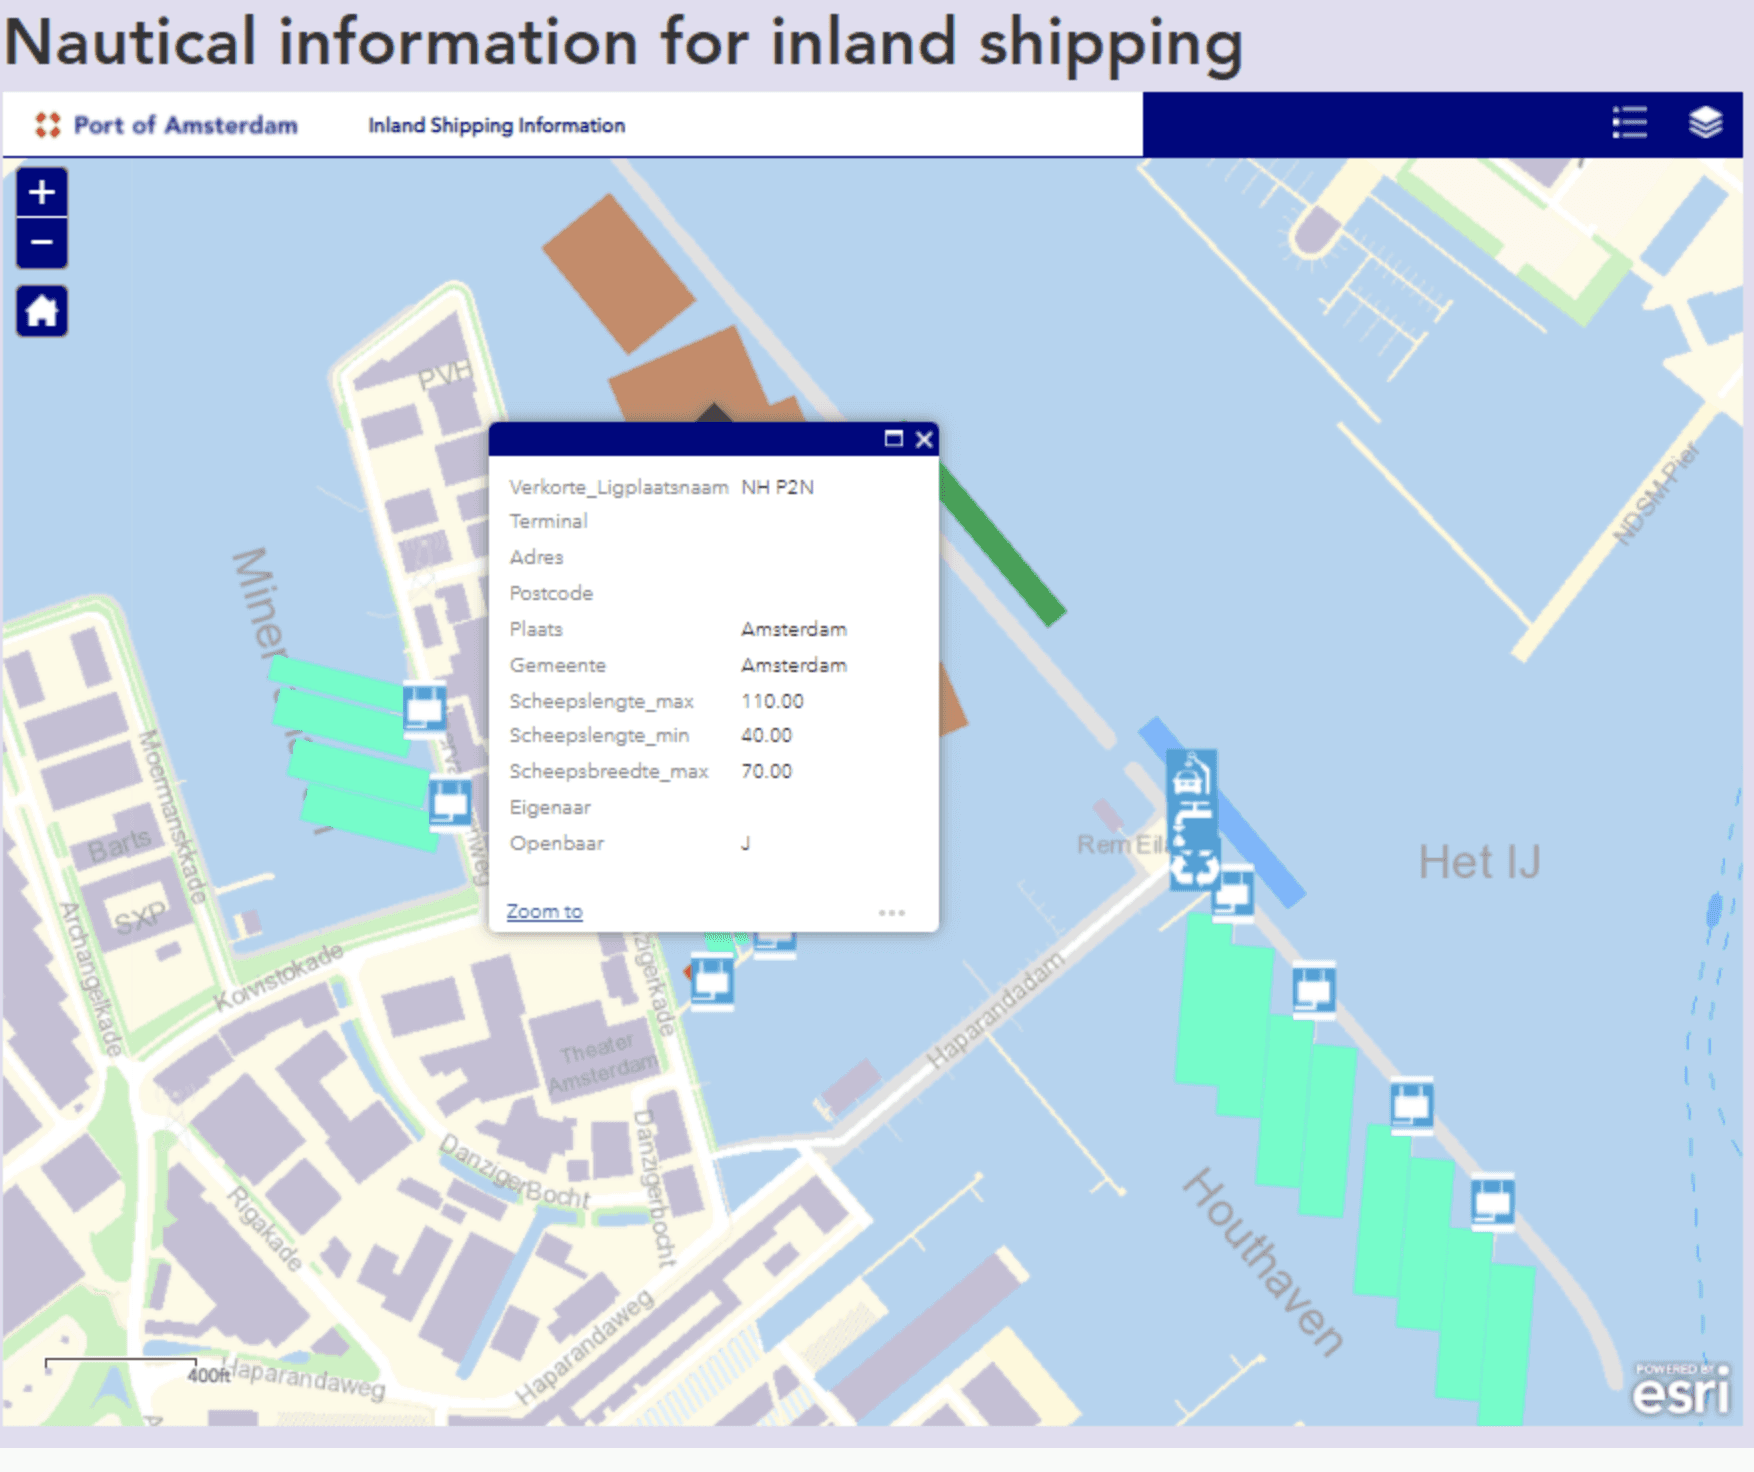
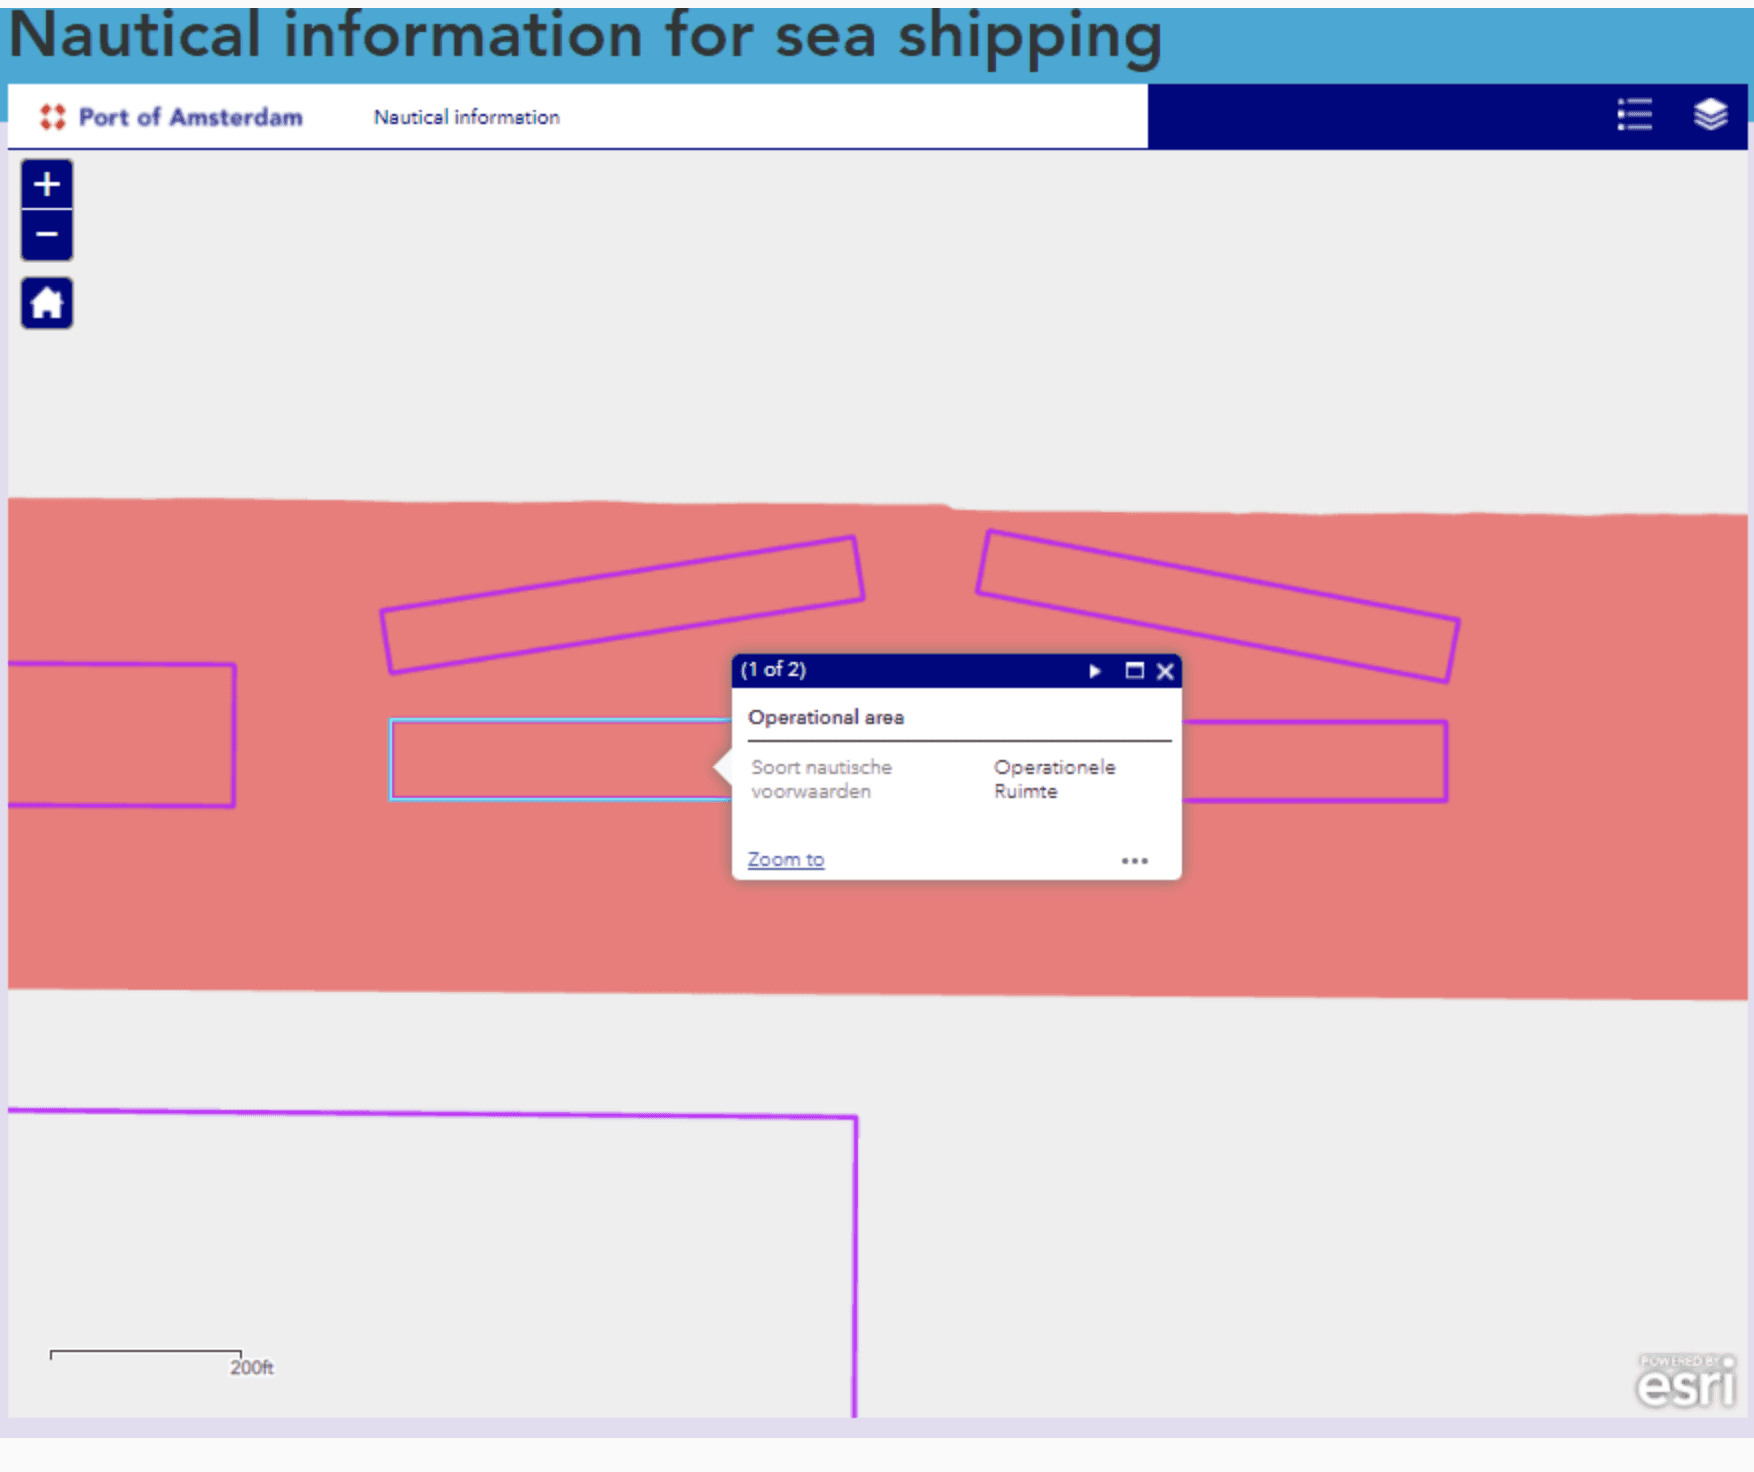
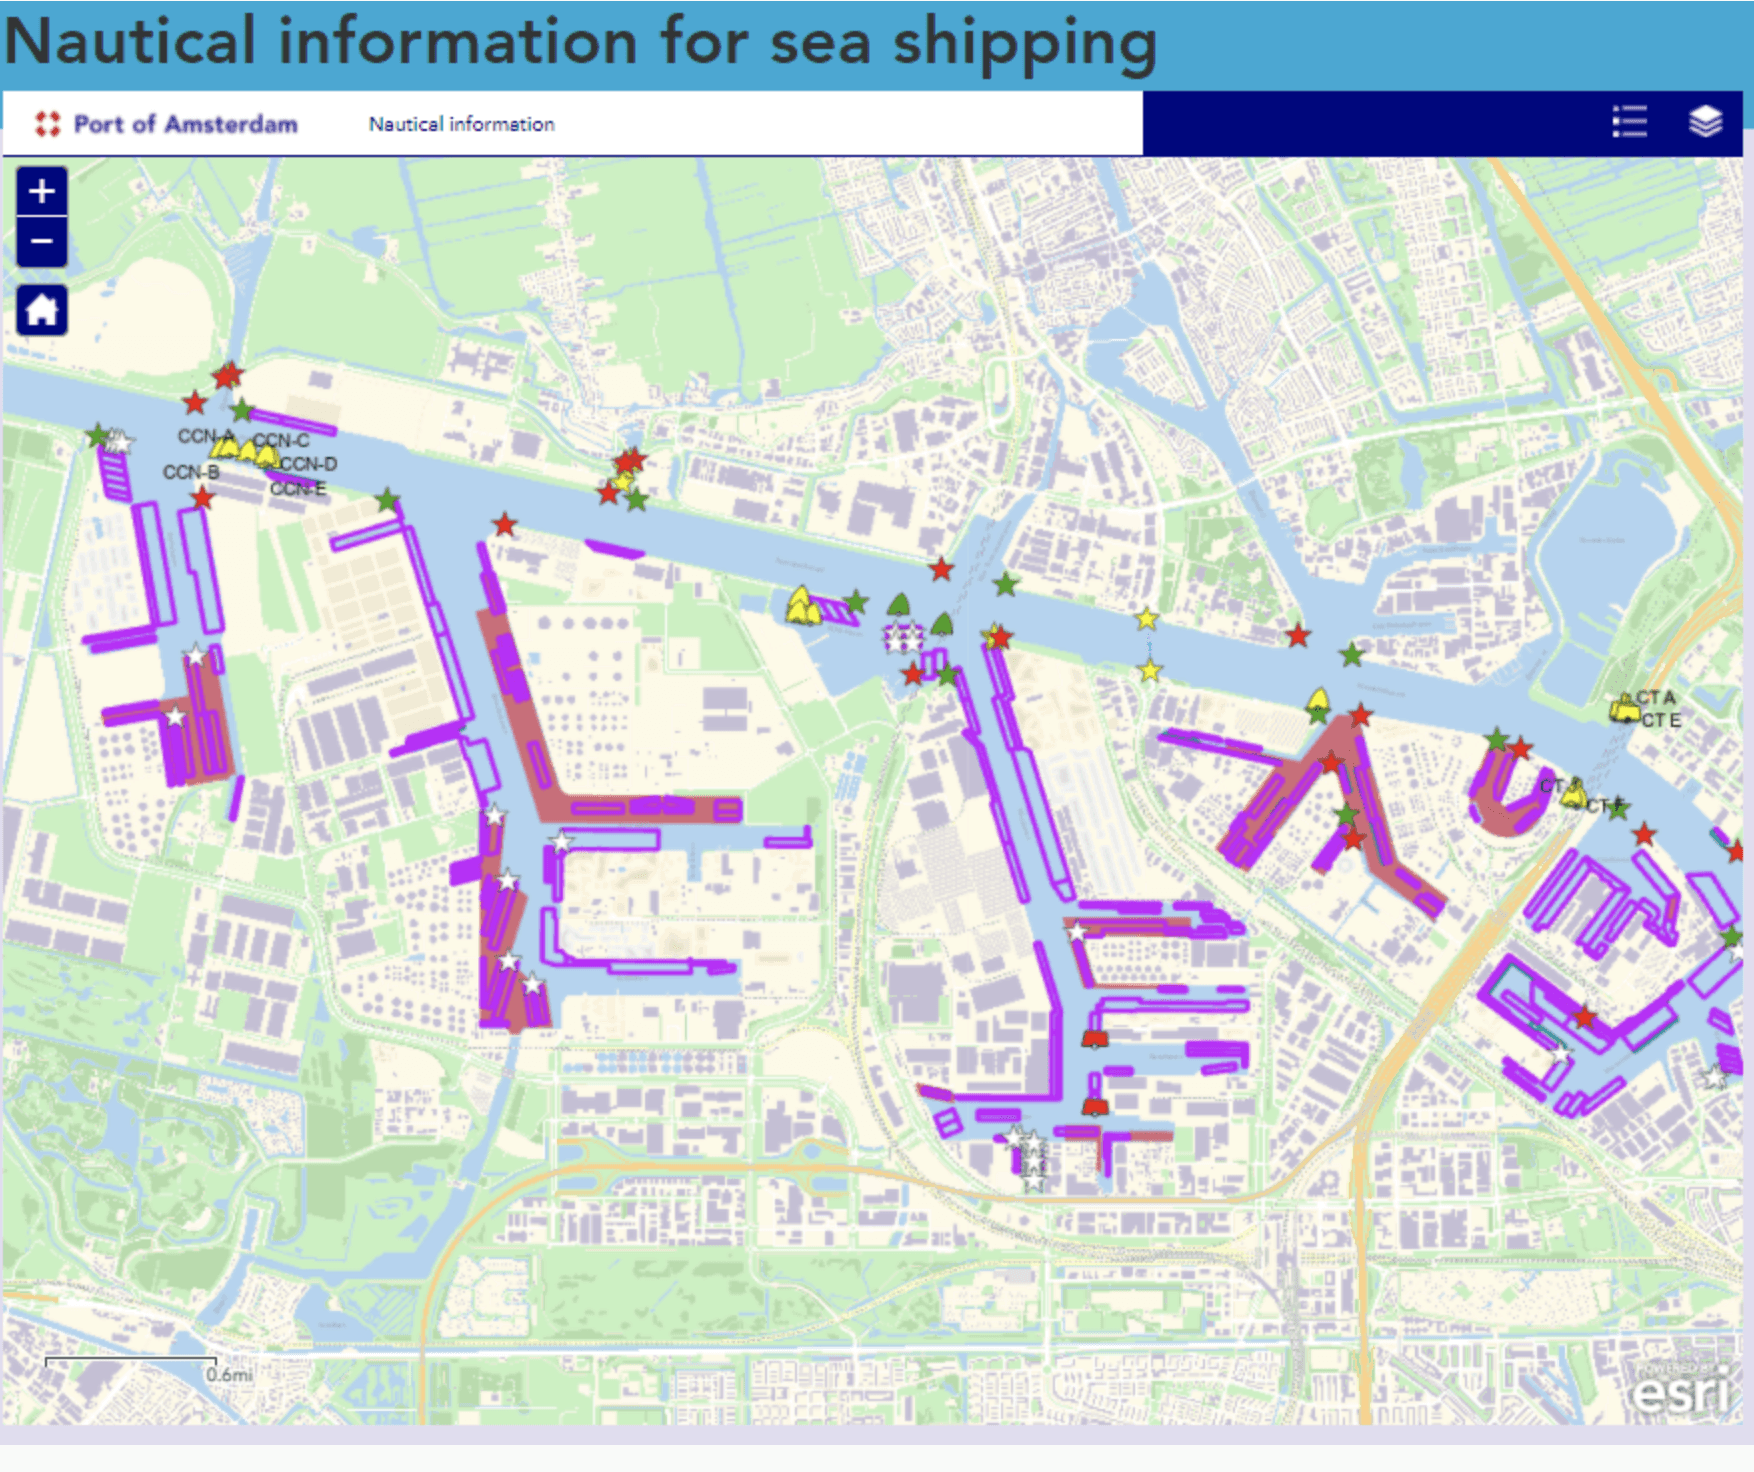
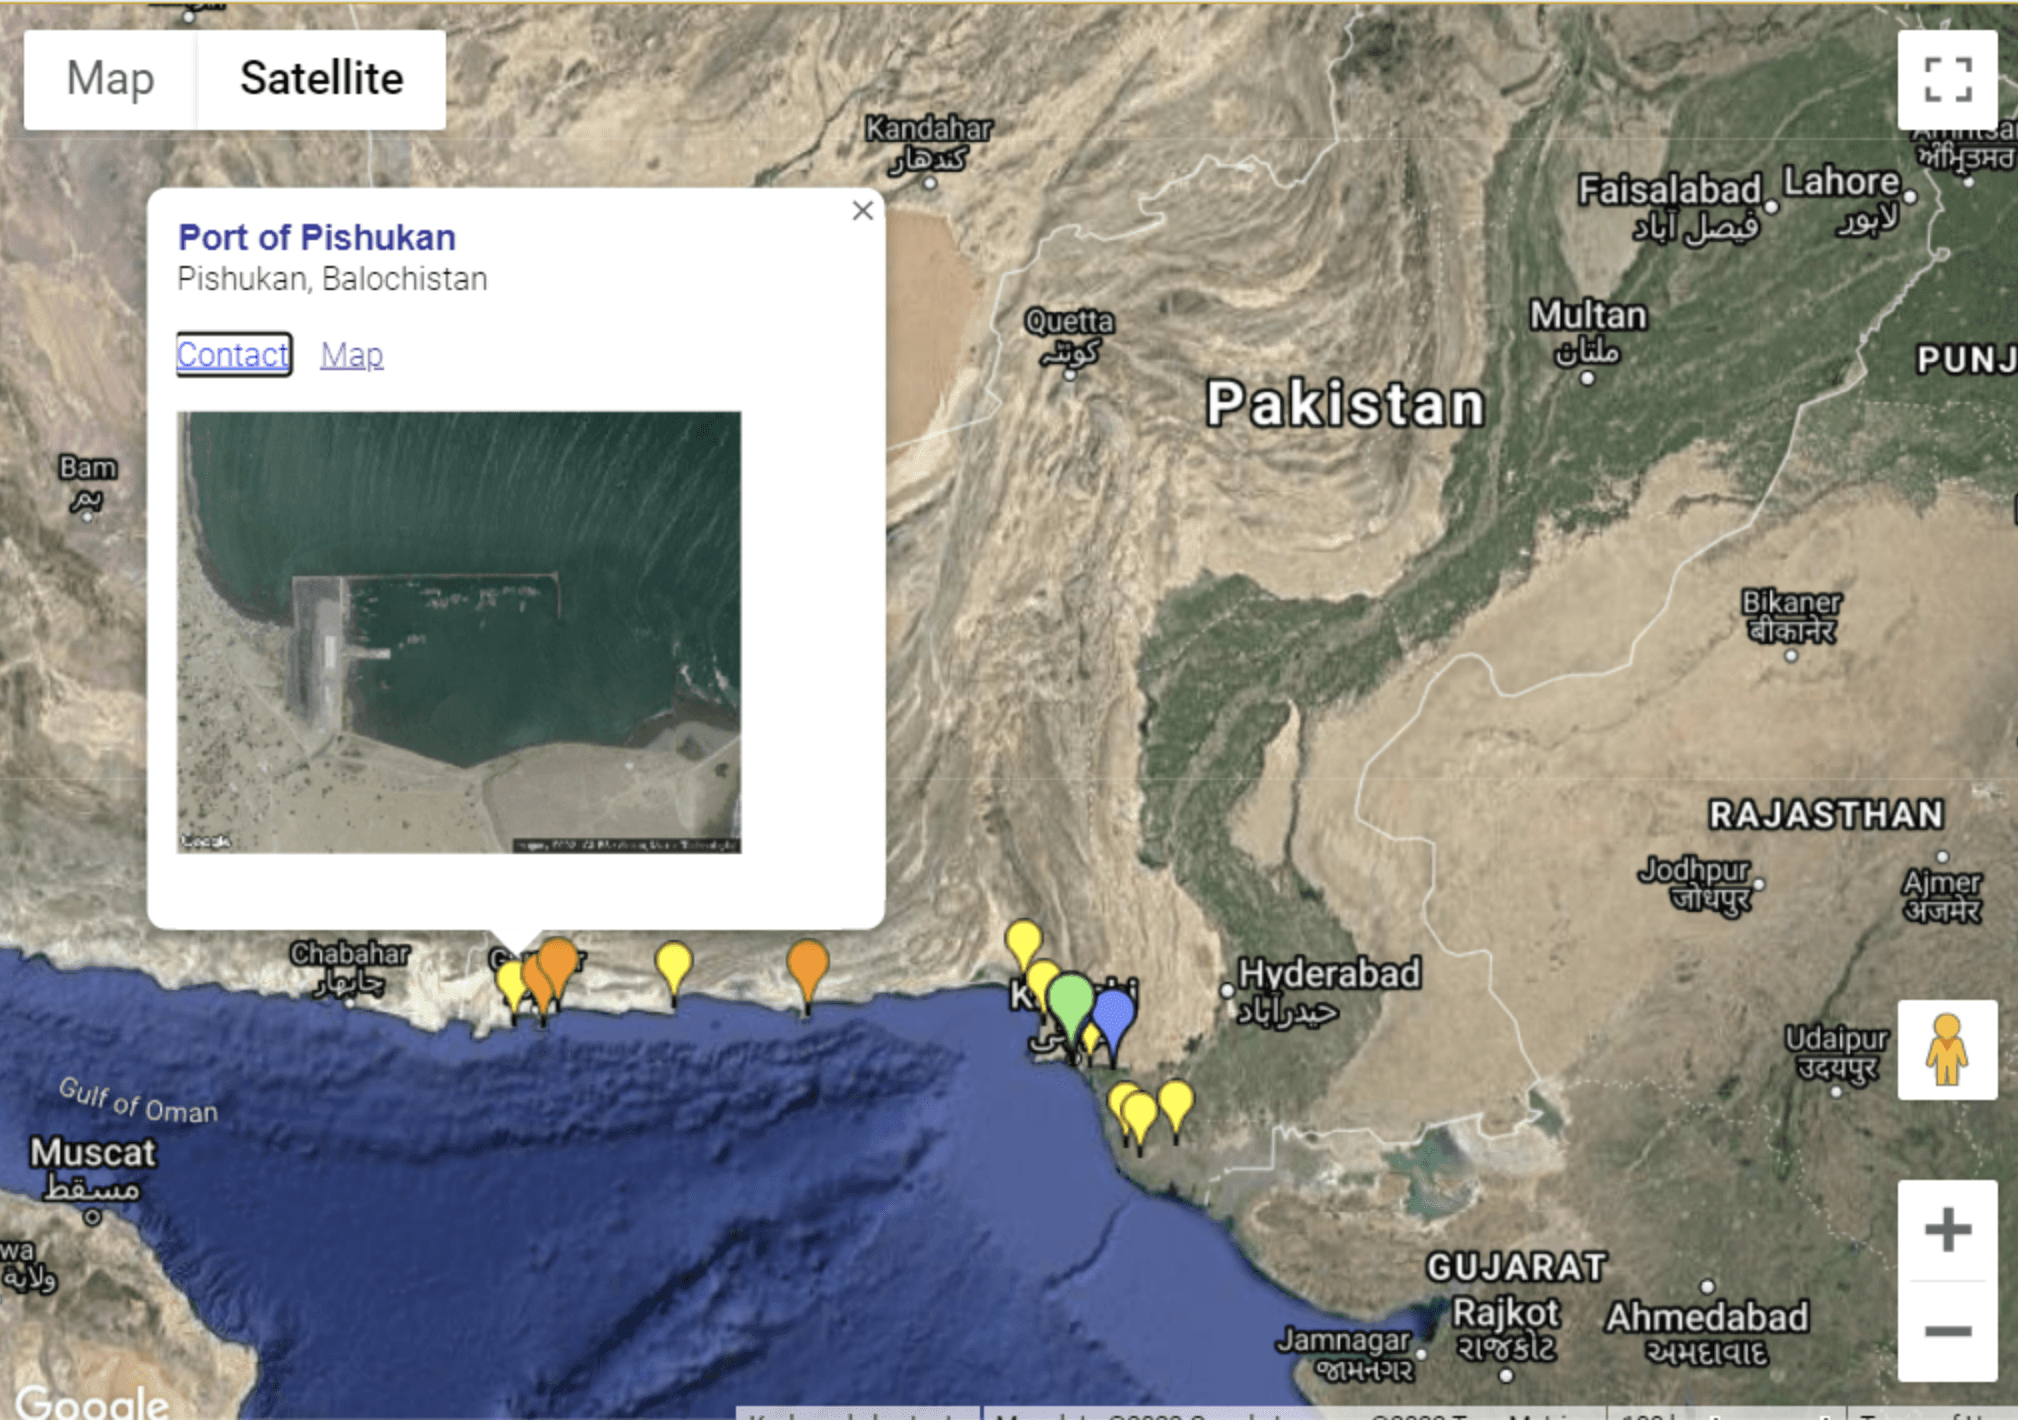
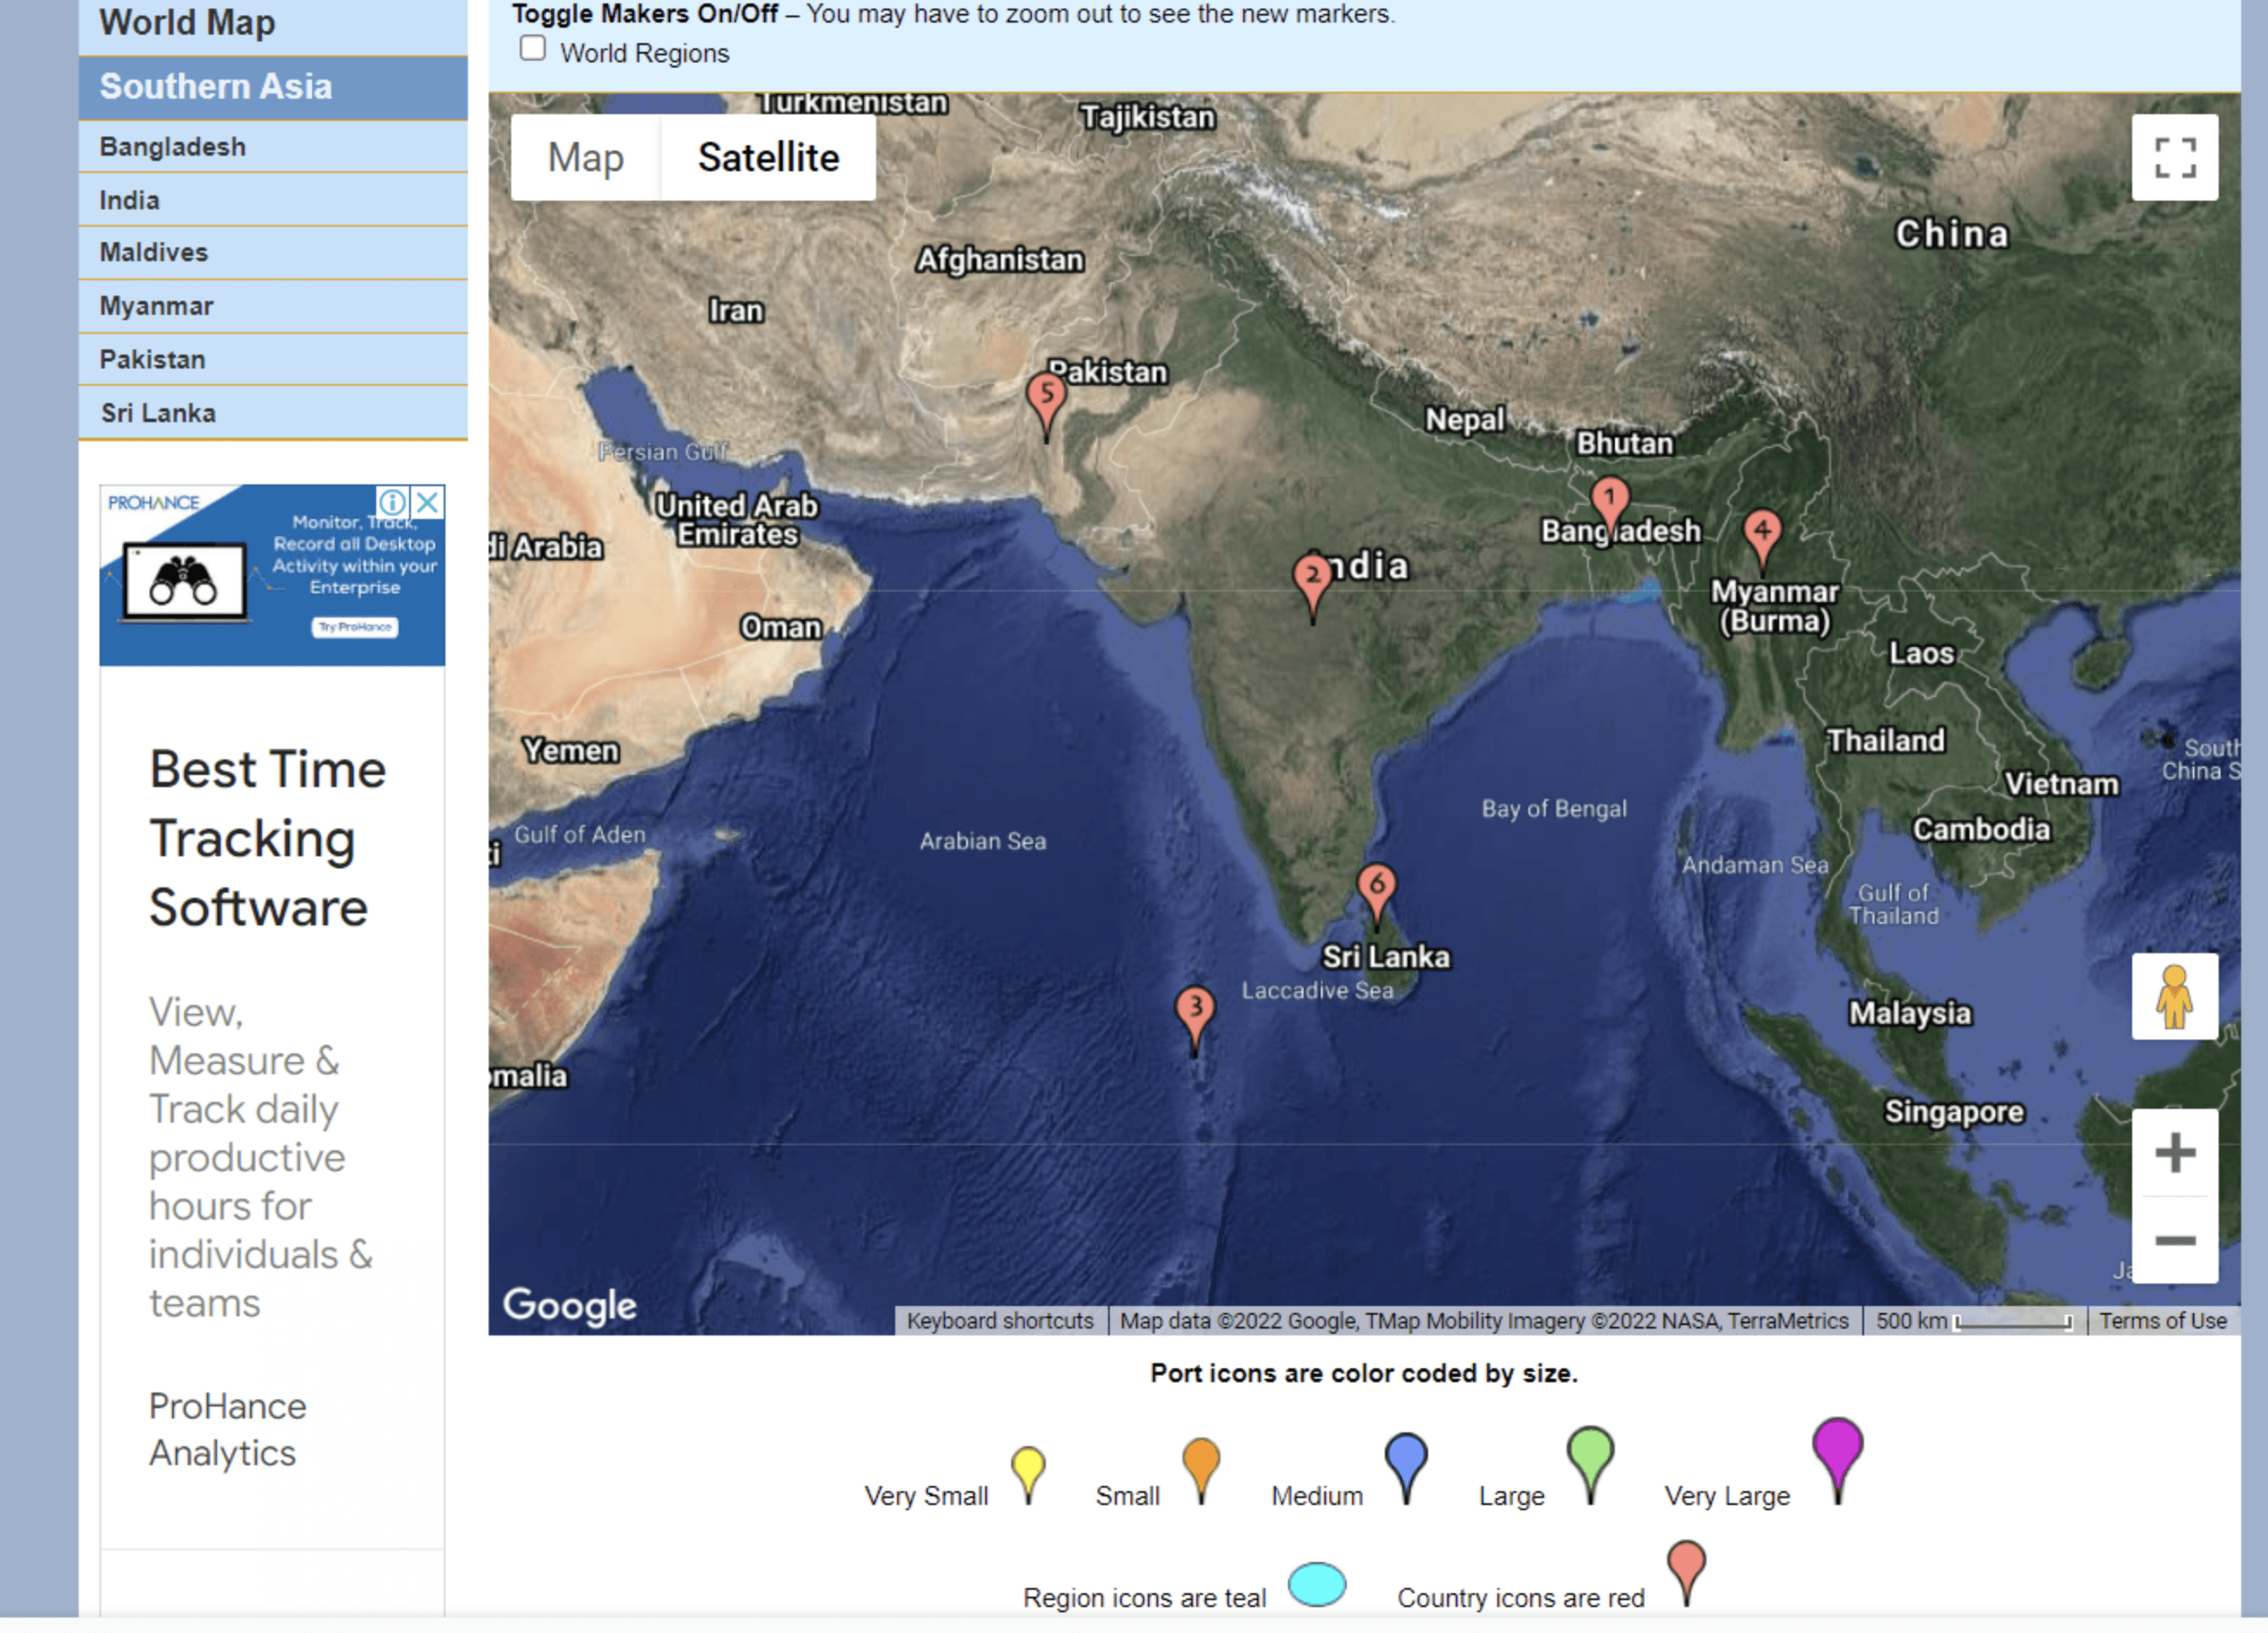
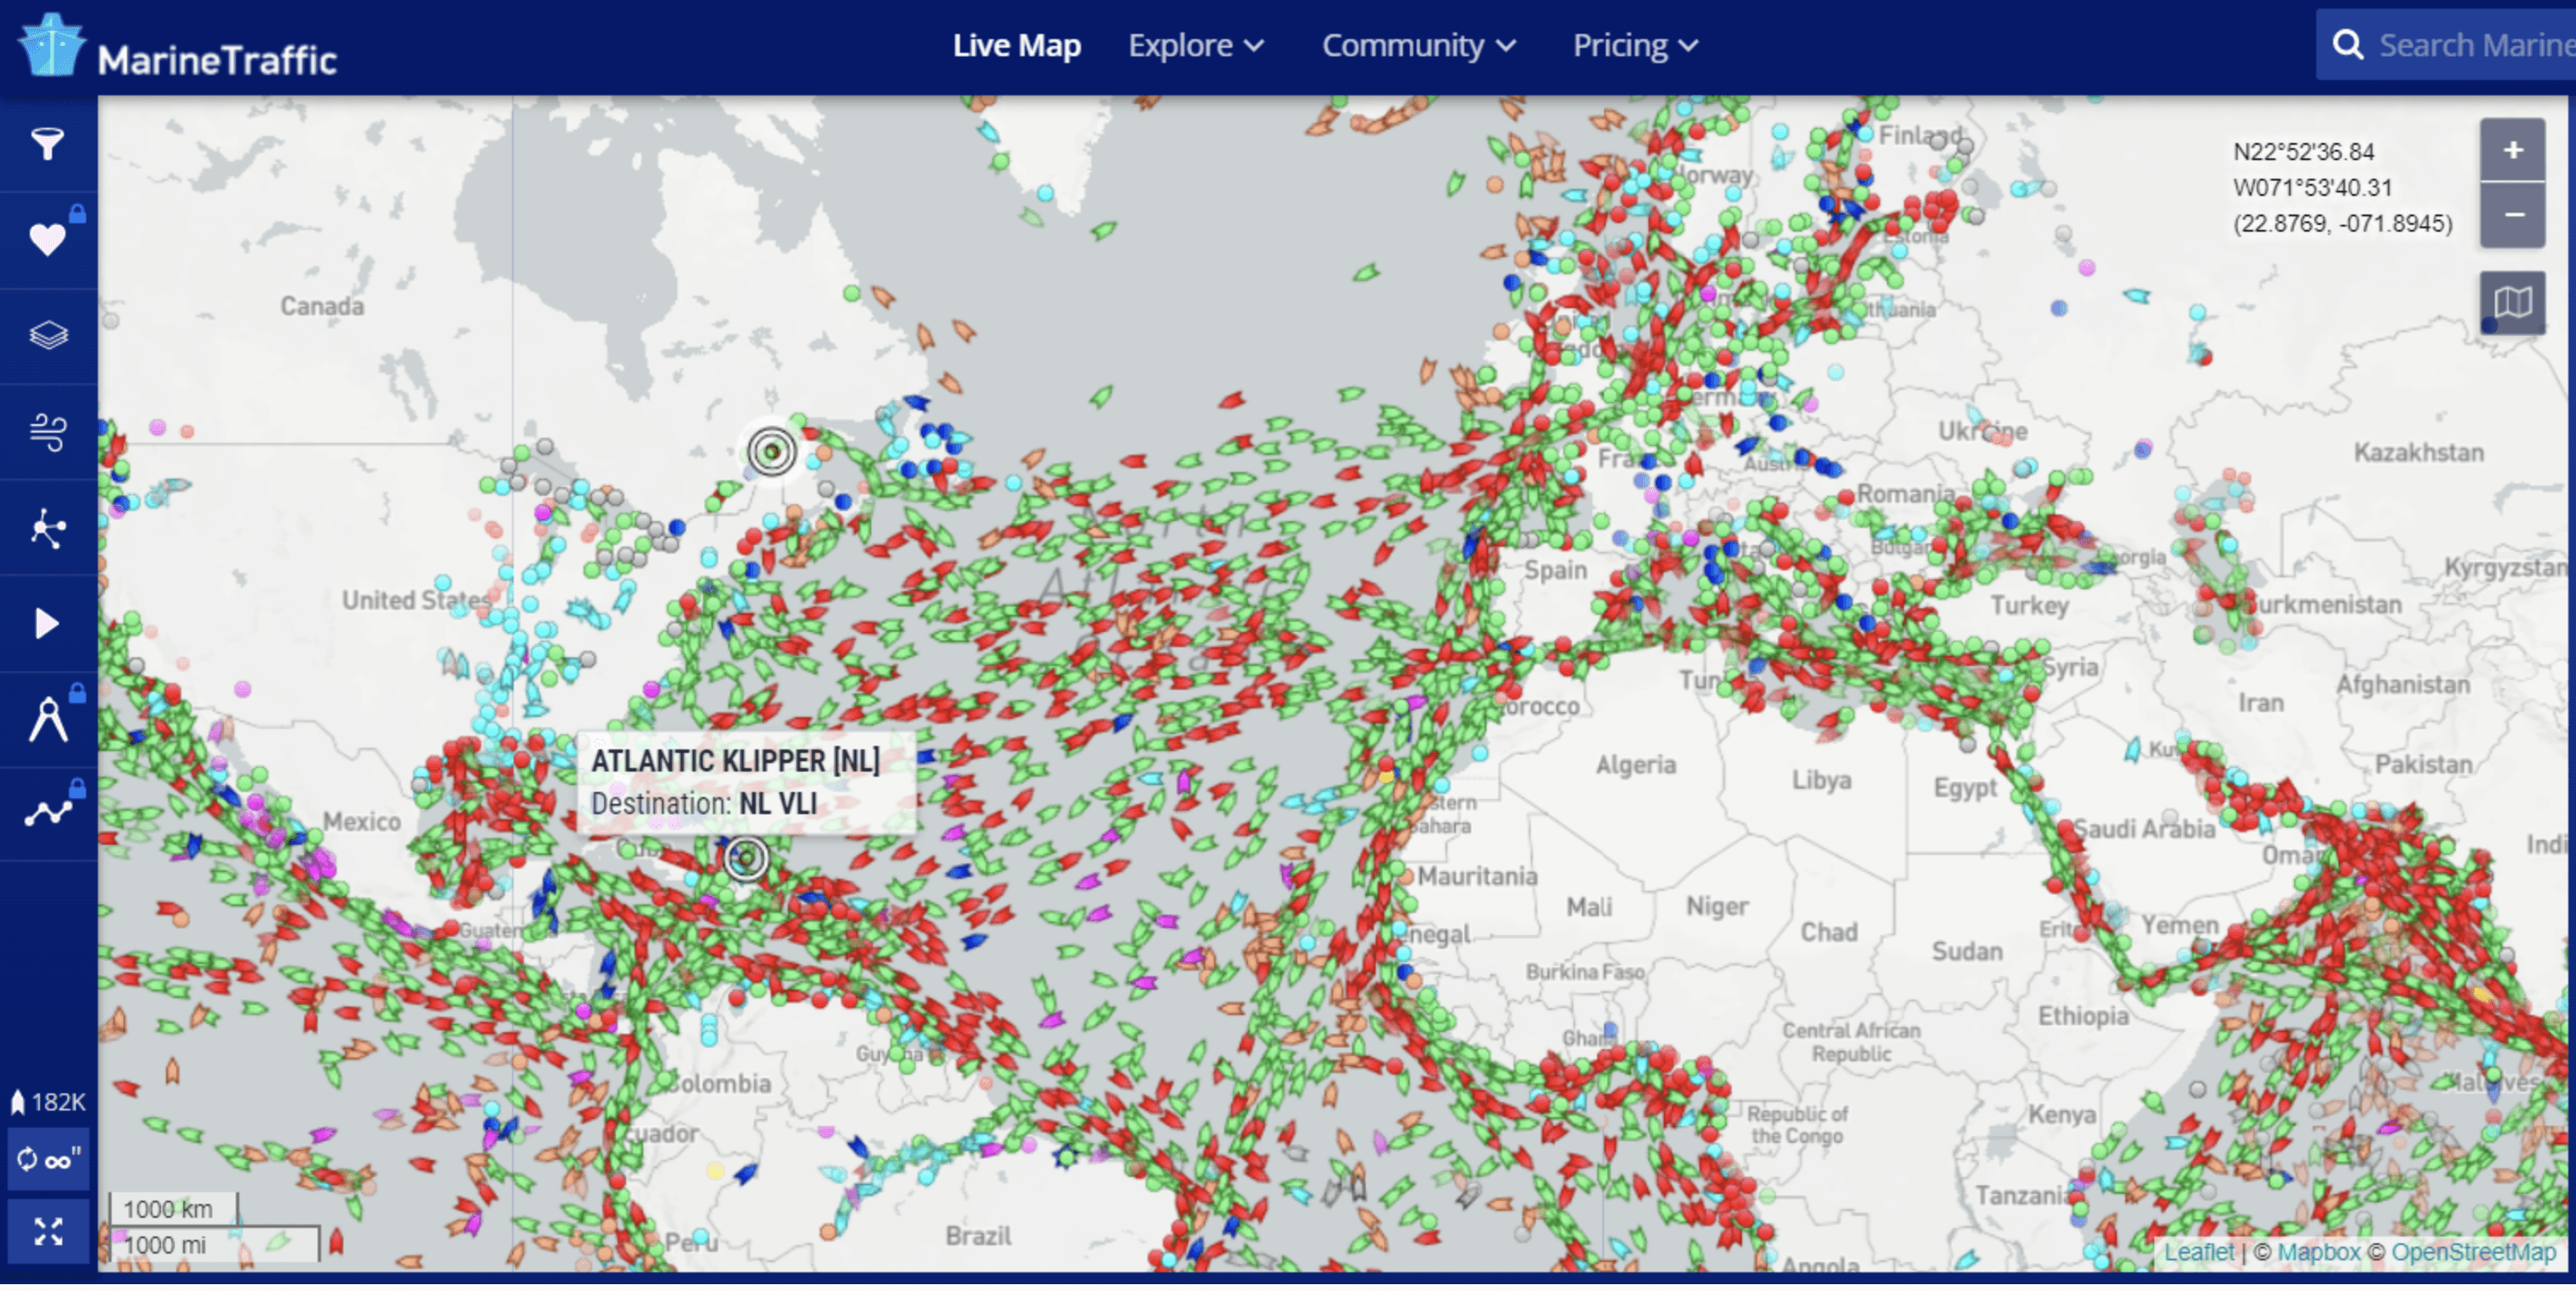
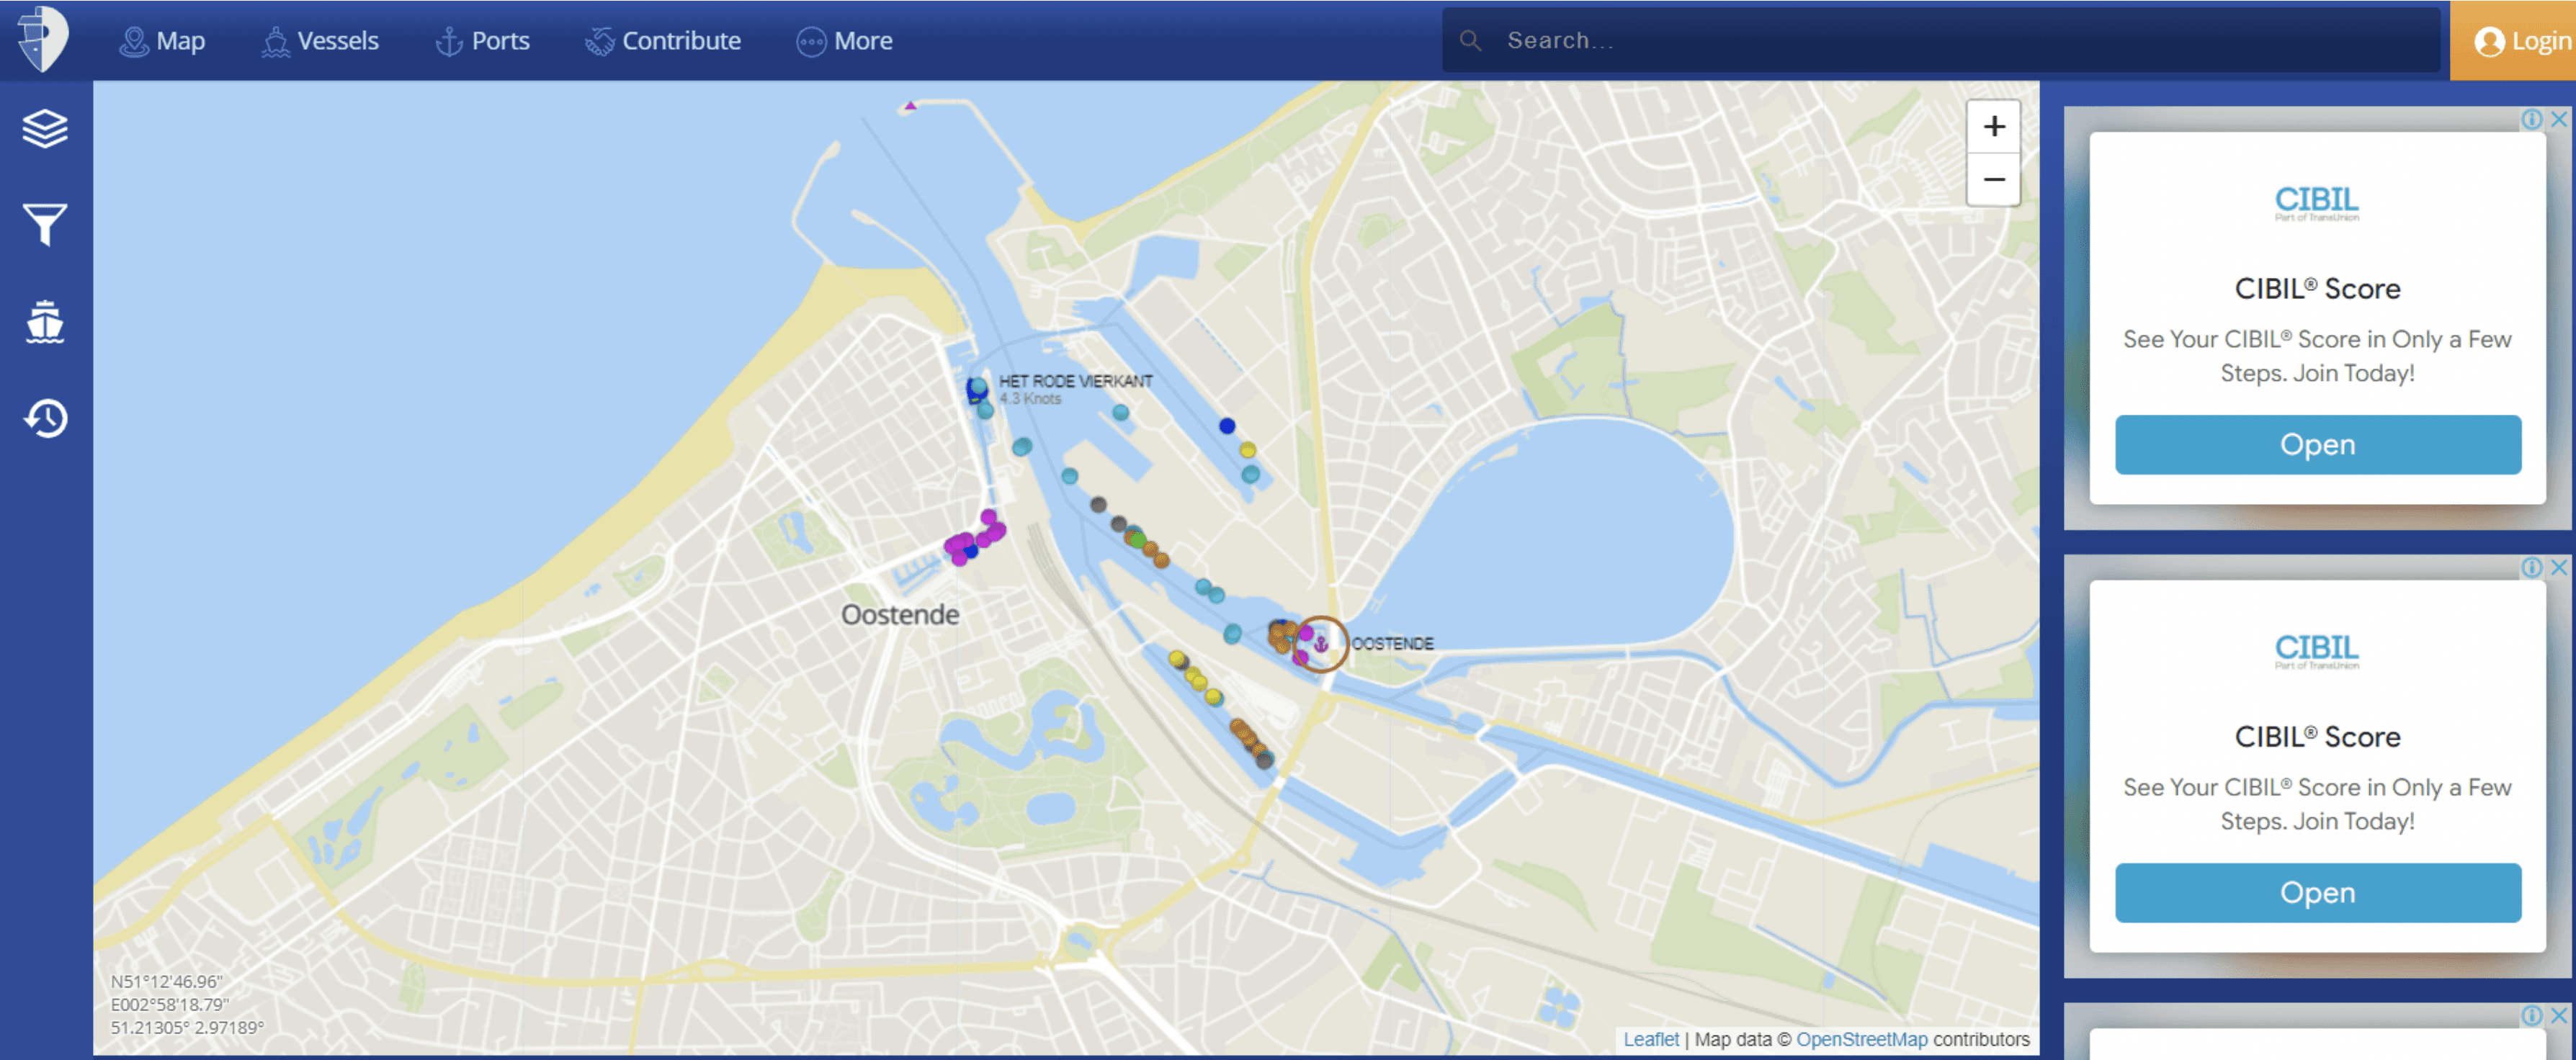

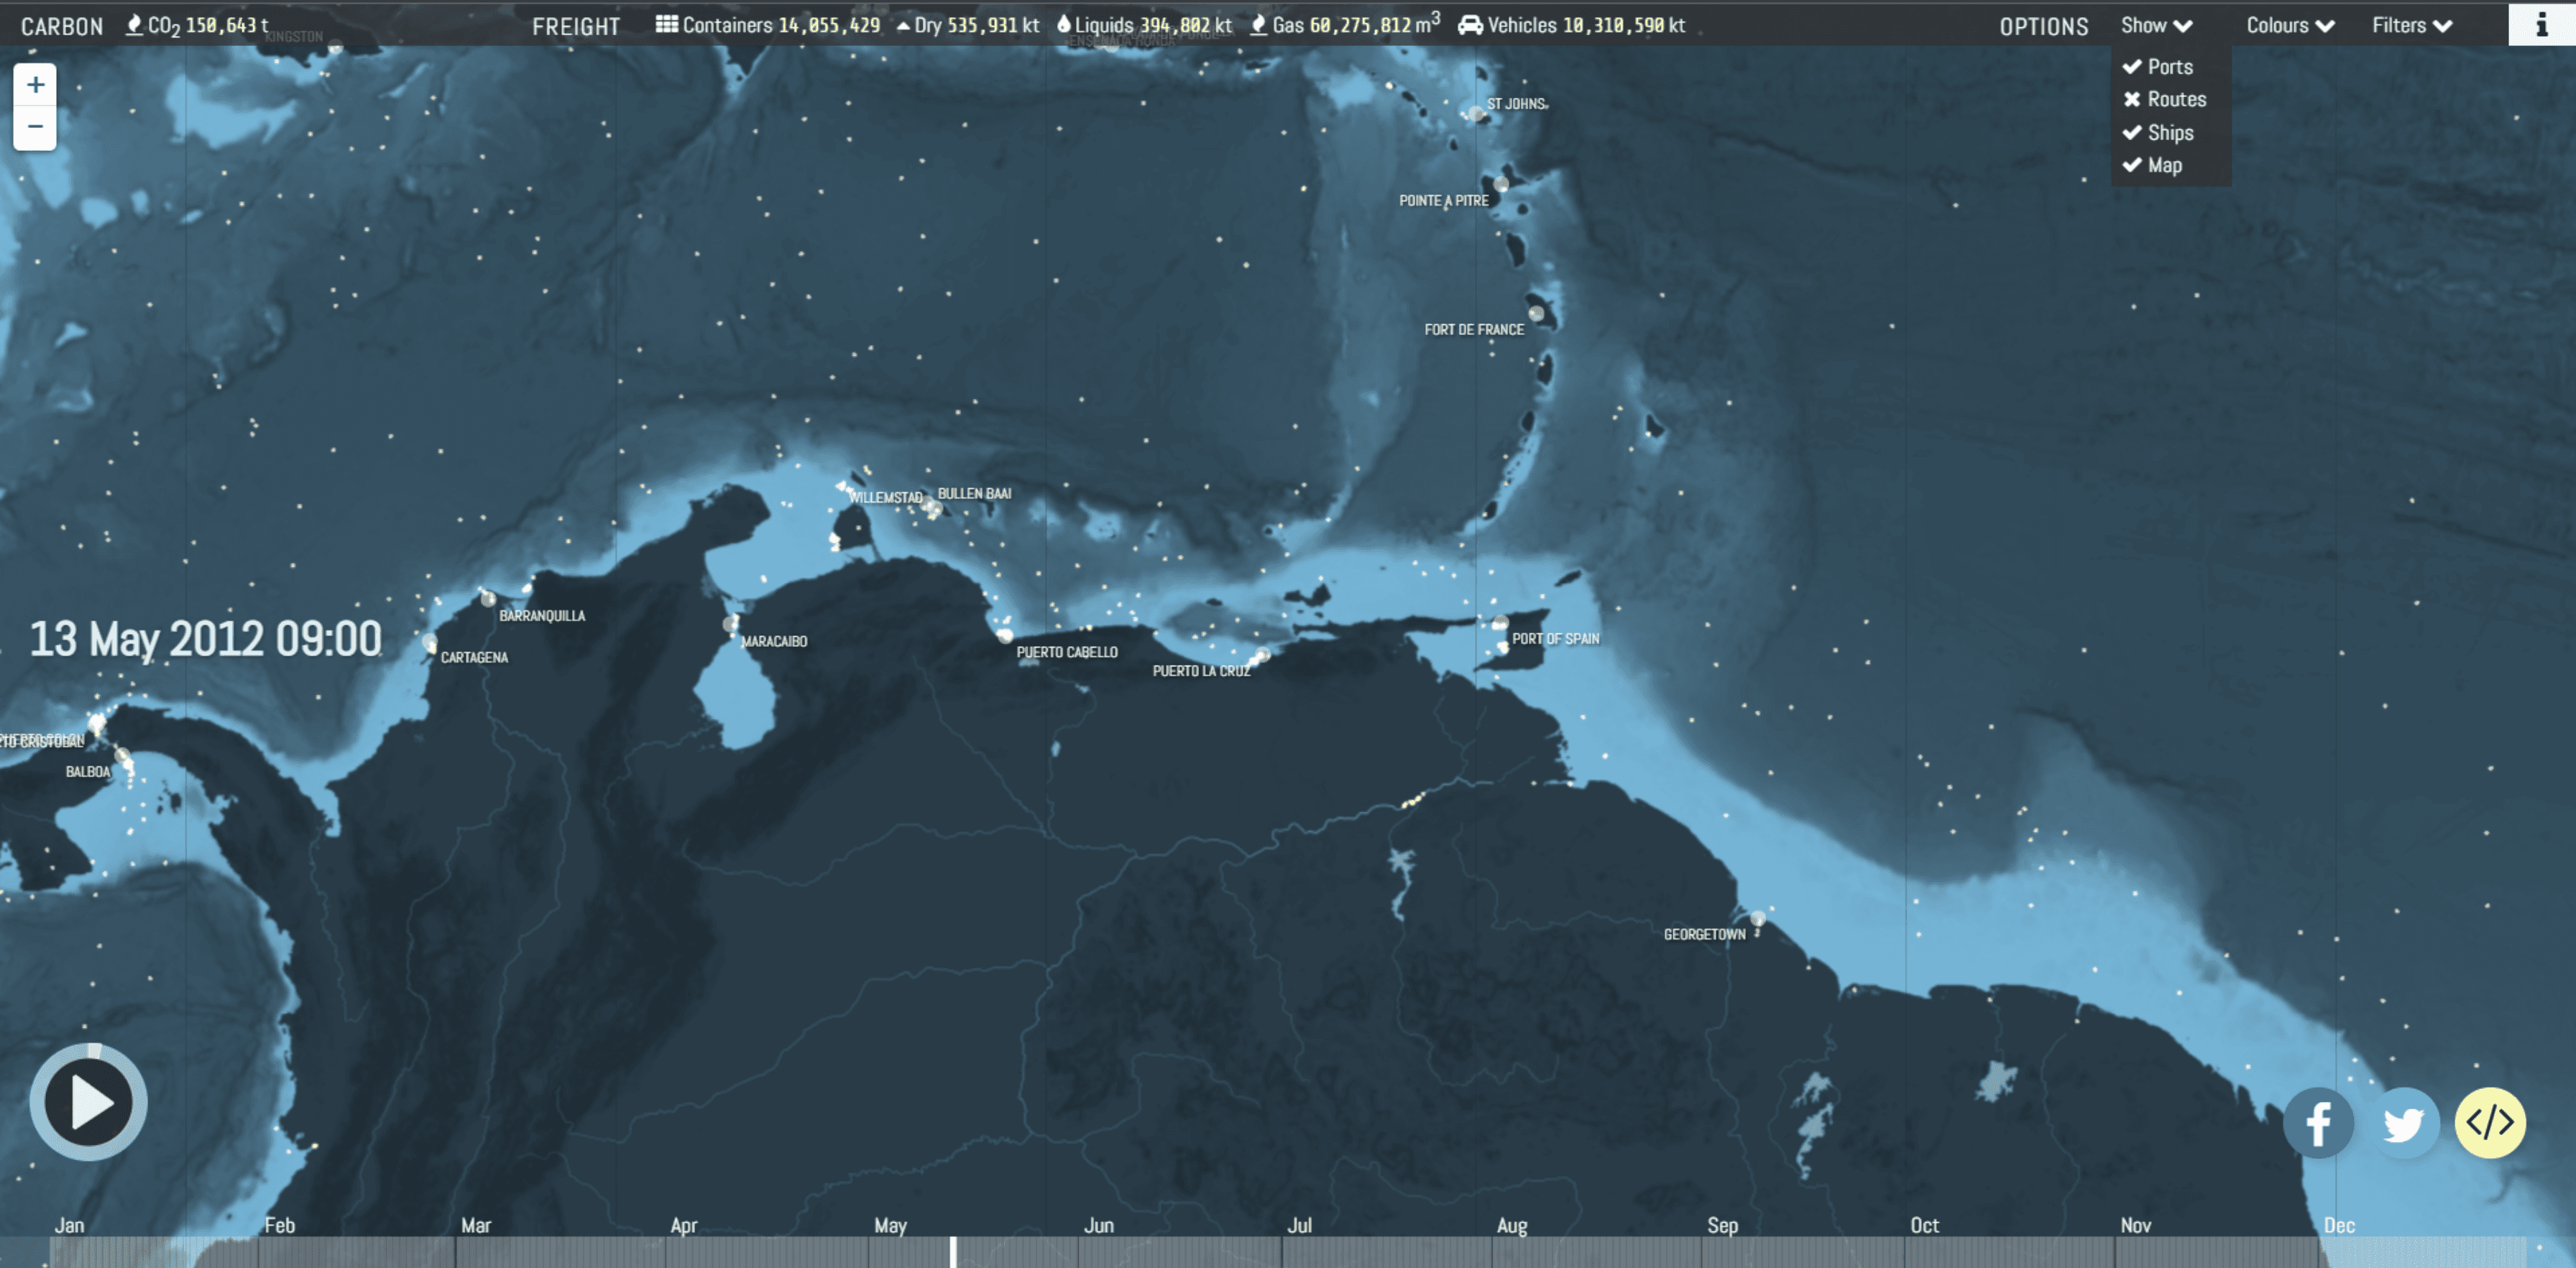
Snapshots of the open-source referential data
Case Study Brief
In this case study we’ll be tackling with one segment of the application that deals with ‘Locations’ for marine operations.

Project Overview
The application is designed to be a golden database for data stewards and the entire Marine team to refer to with details regarding any vessel, organization, location, cargo & detail structure.
Client
bp (Beyond Petroleum)
User Group
Data Stewards
Marine team
Duration
1.5 years
Screens
20+
Team
Multiple Designers
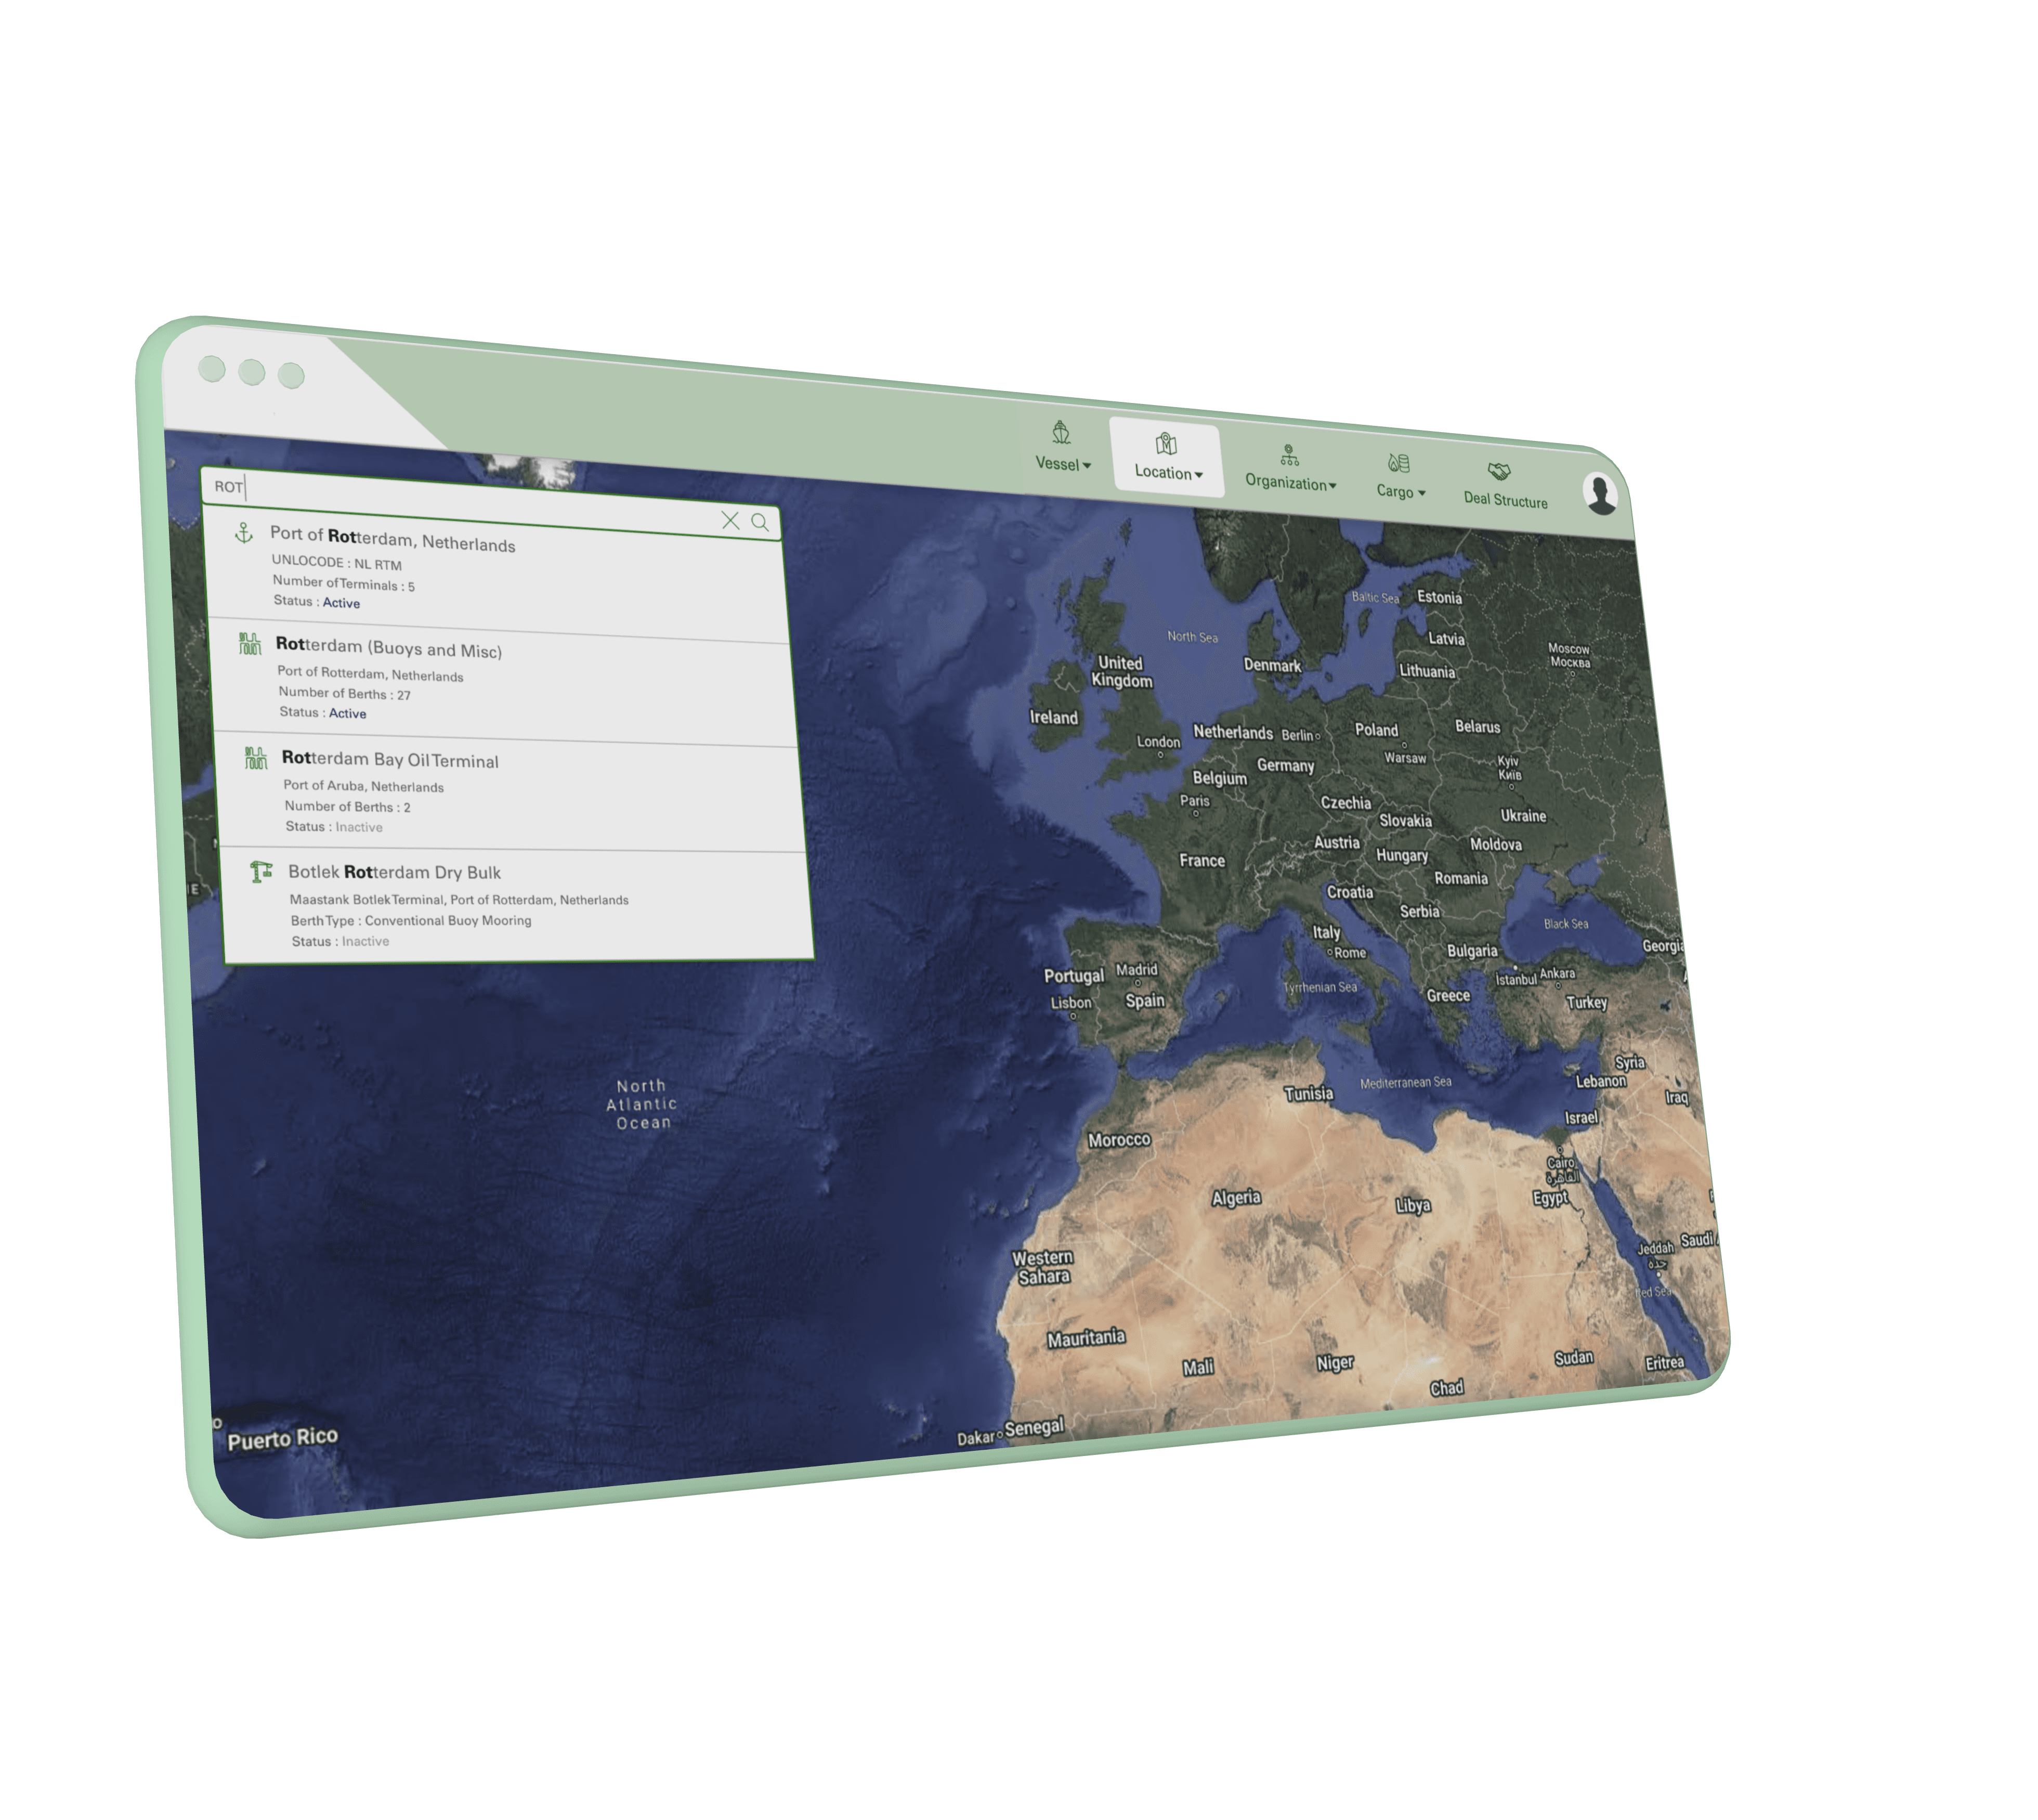
Users should be allowed to locate a particular location on the map, make amends to the co-ordinates, view details about a particular port, terminal, berth in order to conduct assessments, inspections and consider an asset acceptable for their service.
User Requirement
This functionality was not implemented in the legacy application that we are currently revamping. The inclusion of a world map and plotting, is a completely new experience for the user, hence references were used to understand how users currently navigate around the problem at hand.

Interested in some more case studies?
Back to top
